Cajun vs Delaware Child Poverty Under the Age of 16
COMPARE
Cajun
Delaware
Child Poverty Under the Age of 16
Child Poverty Under the Age of 16 Comparison
Cajuns
Delaware
22.1%
CHILD POVERTY UNDER THE AGE OF 16
0.0/ 100
METRIC RATING
320th/ 347
METRIC RANK
17.0%
CHILD POVERTY UNDER THE AGE OF 16
17.1/ 100
METRIC RATING
198th/ 347
METRIC RANK
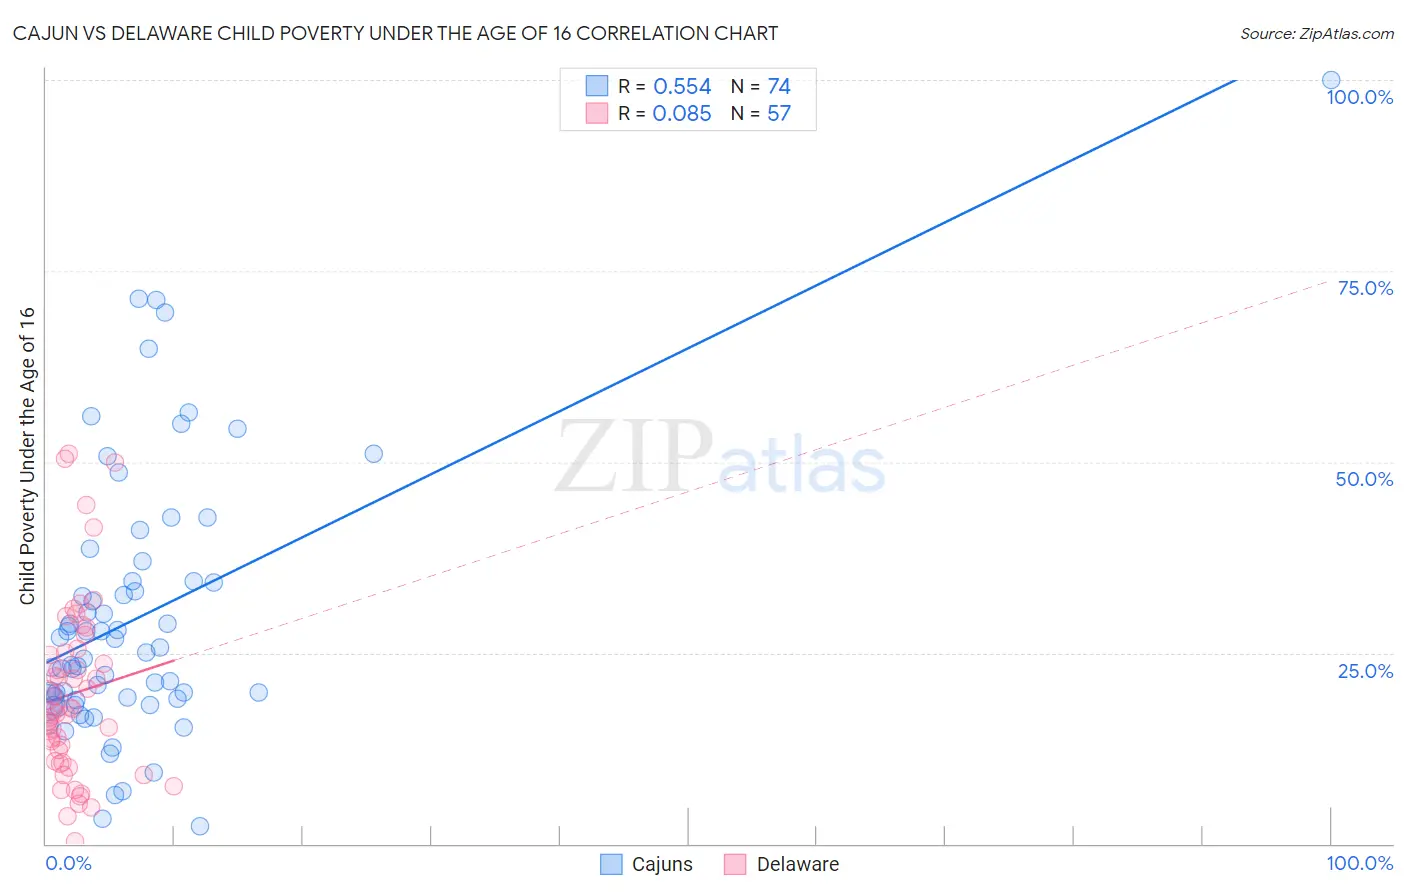
Cajun vs Delaware Child Poverty Under the Age of 16 Correlation Chart
The statistical analysis conducted on geographies consisting of 149,200,833 people shows a substantial positive correlation between the proportion of Cajuns and poverty level among children under the age of 16 in the United States with a correlation coefficient (R) of 0.554 and weighted average of 22.1%. Similarly, the statistical analysis conducted on geographies consisting of 95,926,108 people shows a slight positive correlation between the proportion of Delaware and poverty level among children under the age of 16 in the United States with a correlation coefficient (R) of 0.085 and weighted average of 17.0%, a difference of 30.3%.
Child Poverty Under the Age of 16 Correlation Summary
| Measurement | Cajun | Delaware |
| Minimum | 2.4% | 0.33% |
| Maximum | 100.0% | 51.0% |
| Range | 97.6% | 50.7% |
| Mean | 29.5% | 19.7% |
| Median | 24.6% | 17.4% |
| Interquartile 25% (IQ1) | 18.9% | 10.7% |
| Interquartile 75% (IQ3) | 34.3% | 25.3% |
| Interquartile Range (IQR) | 15.4% | 14.6% |
| Standard Deviation (Sample) | 17.6% | 11.7% |
| Standard Deviation (Population) | 17.5% | 11.6% |
Similar Demographics by Child Poverty Under the Age of 16
Demographics Similar to Cajuns by Child Poverty Under the Age of 16
In terms of child poverty under the age of 16, the demographic groups most similar to Cajuns are Kiowa (22.2%, a difference of 0.19%), Yakama (22.1%, a difference of 0.20%), Honduran (22.2%, a difference of 0.37%), U.S. Virgin Islander (22.0%, a difference of 0.71%), and Immigrants from Dominica (21.9%, a difference of 1.1%).
| Demographics | Rating | Rank | Child Poverty Under the Age of 16 |
| Creek | 0.0 /100 | #313 | Tragic 21.5% |
| Immigrants | Somalia | 0.0 /100 | #314 | Tragic 21.6% |
| Immigrants | Guatemala | 0.0 /100 | #315 | Tragic 21.6% |
| Africans | 0.0 /100 | #316 | Tragic 21.7% |
| Immigrants | Dominica | 0.0 /100 | #317 | Tragic 21.9% |
| U.S. Virgin Islanders | 0.0 /100 | #318 | Tragic 22.0% |
| Yakama | 0.0 /100 | #319 | Tragic 22.1% |
| Cajuns | 0.0 /100 | #320 | Tragic 22.1% |
| Kiowa | 0.0 /100 | #321 | Tragic 22.2% |
| Hondurans | 0.0 /100 | #322 | Tragic 22.2% |
| Paiute | 0.0 /100 | #323 | Tragic 22.4% |
| Central American Indians | 0.0 /100 | #324 | Tragic 22.5% |
| Immigrants | Congo | 0.0 /100 | #325 | Tragic 22.5% |
| Immigrants | Honduras | 0.0 /100 | #326 | Tragic 22.7% |
| Menominee | 0.0 /100 | #327 | Tragic 23.0% |
Demographics Similar to Delaware by Child Poverty Under the Age of 16
In terms of child poverty under the age of 16, the demographic groups most similar to Delaware are Immigrants from Kenya (16.9%, a difference of 0.40%), Immigrants from Afghanistan (17.0%, a difference of 0.41%), Immigrants from Cameroon (17.1%, a difference of 0.51%), Immigrants from Uzbekistan (17.1%, a difference of 0.52%), and Ugandan (17.1%, a difference of 0.60%).
| Demographics | Rating | Rank | Child Poverty Under the Age of 16 |
| Immigrants | Iraq | 28.3 /100 | #191 | Fair 16.7% |
| Spanish | 24.5 /100 | #192 | Fair 16.7% |
| Spaniards | 23.2 /100 | #193 | Fair 16.8% |
| Immigrants | Uruguay | 23.1 /100 | #194 | Fair 16.8% |
| Immigrants | Uganda | 22.5 /100 | #195 | Fair 16.8% |
| Immigrants | Lebanon | 22.0 /100 | #196 | Fair 16.8% |
| Immigrants | Kenya | 19.1 /100 | #197 | Poor 16.9% |
| Delaware | 17.1 /100 | #198 | Poor 17.0% |
| Immigrants | Afghanistan | 15.1 /100 | #199 | Poor 17.0% |
| Immigrants | Cameroon | 14.7 /100 | #200 | Poor 17.1% |
| Immigrants | Uzbekistan | 14.7 /100 | #201 | Poor 17.1% |
| Ugandans | 14.3 /100 | #202 | Poor 17.1% |
| Immigrants | Sierra Leone | 14.2 /100 | #203 | Poor 17.1% |
| Hmong | 14.0 /100 | #204 | Poor 17.1% |
| Aleuts | 13.9 /100 | #205 | Poor 17.1% |