Immigrants from Latvia vs Chippewa Male Poverty
COMPARE
Immigrants from Latvia
Chippewa
Male Poverty
Male Poverty Comparison
Immigrants from Latvia
Chippewa
10.5%
MALE POVERTY
92.8/ 100
METRIC RATING
100th/ 347
METRIC RANK
14.6%
MALE POVERTY
0.0/ 100
METRIC RATING
315th/ 347
METRIC RANK
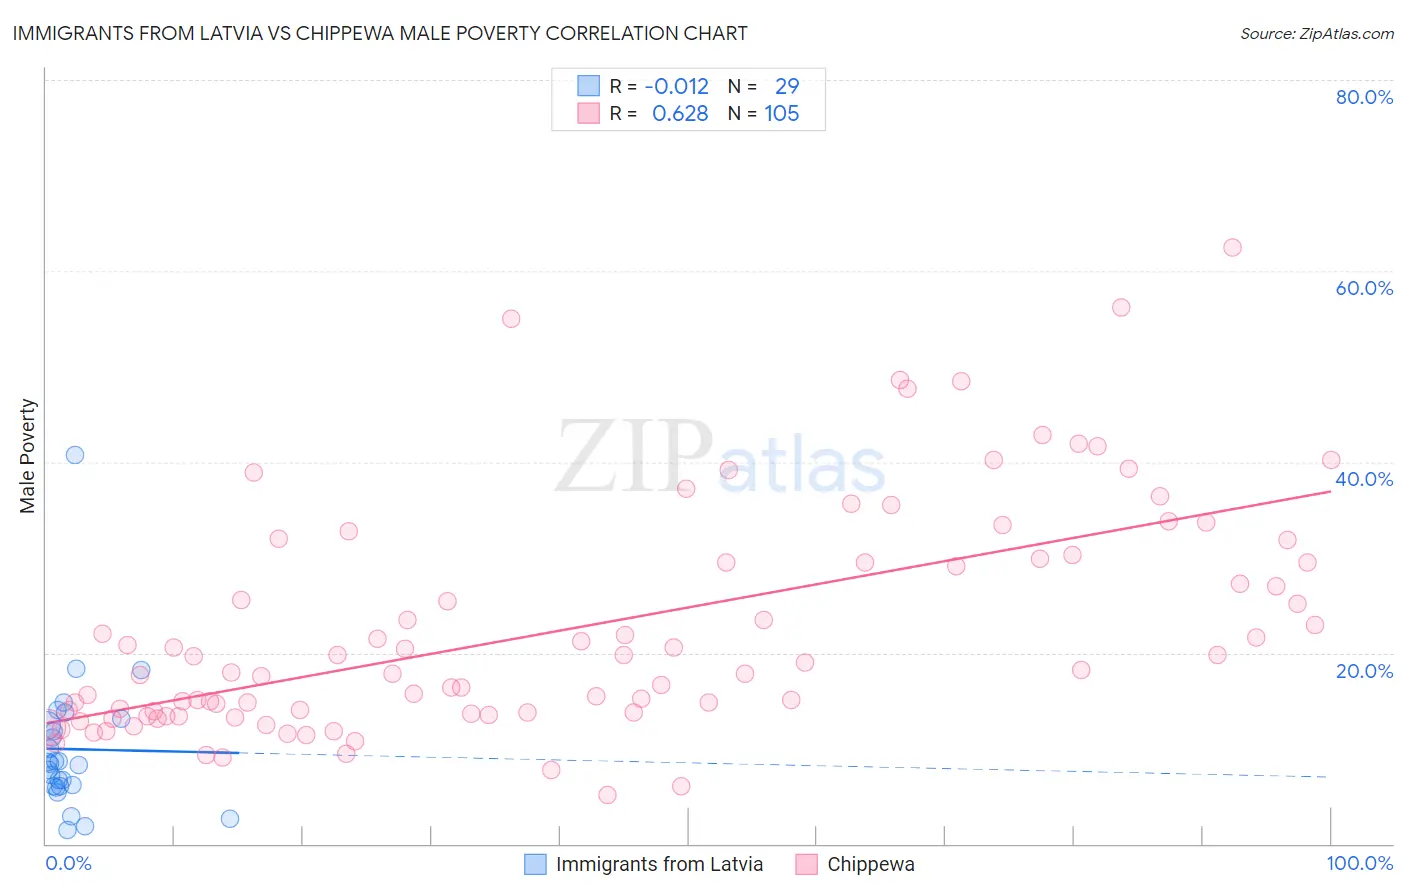
Immigrants from Latvia vs Chippewa Male Poverty Correlation Chart
The statistical analysis conducted on geographies consisting of 113,727,577 people shows no correlation between the proportion of Immigrants from Latvia and poverty level among males in the United States with a correlation coefficient (R) of -0.012 and weighted average of 10.5%. Similarly, the statistical analysis conducted on geographies consisting of 214,985,801 people shows a significant positive correlation between the proportion of Chippewa and poverty level among males in the United States with a correlation coefficient (R) of 0.628 and weighted average of 14.6%, a difference of 39.1%.
Male Poverty Correlation Summary
| Measurement | Immigrants from Latvia | Chippewa |
| Minimum | 1.5% | 5.1% |
| Maximum | 40.7% | 62.5% |
| Range | 39.2% | 57.4% |
| Mean | 9.9% | 22.5% |
| Median | 8.3% | 18.2% |
| Interquartile 25% (IQ1) | 6.1% | 13.6% |
| Interquartile 75% (IQ3) | 12.8% | 29.7% |
| Interquartile Range (IQR) | 6.7% | 16.0% |
| Standard Deviation (Sample) | 7.4% | 12.0% |
| Standard Deviation (Population) | 7.2% | 11.9% |
Similar Demographics by Male Poverty
Demographics Similar to Immigrants from Latvia by Male Poverty
In terms of male poverty, the demographic groups most similar to Immigrants from Latvia are Immigrants from Indonesia (10.5%, a difference of 0.21%), Finnish (10.5%, a difference of 0.28%), Immigrants from Zimbabwe (10.5%, a difference of 0.29%), French Canadian (10.5%, a difference of 0.30%), and Romanian (10.5%, a difference of 0.34%).
| Demographics | Rating | Rank | Male Poverty |
| Australians | 94.4 /100 | #93 | Exceptional 10.4% |
| Immigrants | South Africa | 94.1 /100 | #94 | Exceptional 10.4% |
| Scottish | 94.0 /100 | #95 | Exceptional 10.4% |
| Immigrants | Egypt | 93.7 /100 | #96 | Exceptional 10.4% |
| Romanians | 93.6 /100 | #97 | Exceptional 10.5% |
| Finns | 93.4 /100 | #98 | Exceptional 10.5% |
| Immigrants | Indonesia | 93.3 /100 | #99 | Exceptional 10.5% |
| Immigrants | Latvia | 92.8 /100 | #100 | Exceptional 10.5% |
| Immigrants | Zimbabwe | 92.0 /100 | #101 | Exceptional 10.5% |
| French Canadians | 91.9 /100 | #102 | Exceptional 10.5% |
| Slavs | 91.7 /100 | #103 | Exceptional 10.5% |
| Welsh | 91.6 /100 | #104 | Exceptional 10.5% |
| Canadians | 91.6 /100 | #105 | Exceptional 10.5% |
| Immigrants | Southern Europe | 91.3 /100 | #106 | Exceptional 10.5% |
| Laotians | 91.2 /100 | #107 | Exceptional 10.5% |
Demographics Similar to Chippewa by Male Poverty
In terms of male poverty, the demographic groups most similar to Chippewa are British West Indian (14.6%, a difference of 0.020%), Immigrants from Honduras (14.6%, a difference of 0.080%), Immigrants from Somalia (14.6%, a difference of 0.11%), Immigrants from Dominica (14.7%, a difference of 0.70%), and Immigrants from Grenada (14.7%, a difference of 0.76%).
| Demographics | Rating | Rank | Male Poverty |
| Africans | 0.0 /100 | #308 | Tragic 14.2% |
| Somalis | 0.0 /100 | #309 | Tragic 14.3% |
| Seminole | 0.0 /100 | #310 | Tragic 14.3% |
| Hondurans | 0.0 /100 | #311 | Tragic 14.3% |
| Choctaw | 0.0 /100 | #312 | Tragic 14.4% |
| Immigrants | Somalia | 0.0 /100 | #313 | Tragic 14.6% |
| Immigrants | Honduras | 0.0 /100 | #314 | Tragic 14.6% |
| Chippewa | 0.0 /100 | #315 | Tragic 14.6% |
| British West Indians | 0.0 /100 | #316 | Tragic 14.6% |
| Immigrants | Dominica | 0.0 /100 | #317 | Tragic 14.7% |
| Immigrants | Grenada | 0.0 /100 | #318 | Tragic 14.7% |
| U.S. Virgin Islanders | 0.0 /100 | #319 | Tragic 14.7% |
| Immigrants | Congo | 0.0 /100 | #320 | Tragic 14.7% |
| Arapaho | 0.0 /100 | #321 | Tragic 15.1% |
| Kiowa | 0.0 /100 | #322 | Tragic 15.2% |