Irish vs Sioux Single Male Poverty
COMPARE
Irish
Sioux
Single Male Poverty
Single Male Poverty Comparison
Irish
Sioux
14.0%
SINGLE MALE POVERTY
0.1/ 100
METRIC RATING
271st/ 347
METRIC RANK
22.2%
SINGLE MALE POVERTY
0.0/ 100
METRIC RATING
340th/ 347
METRIC RANK
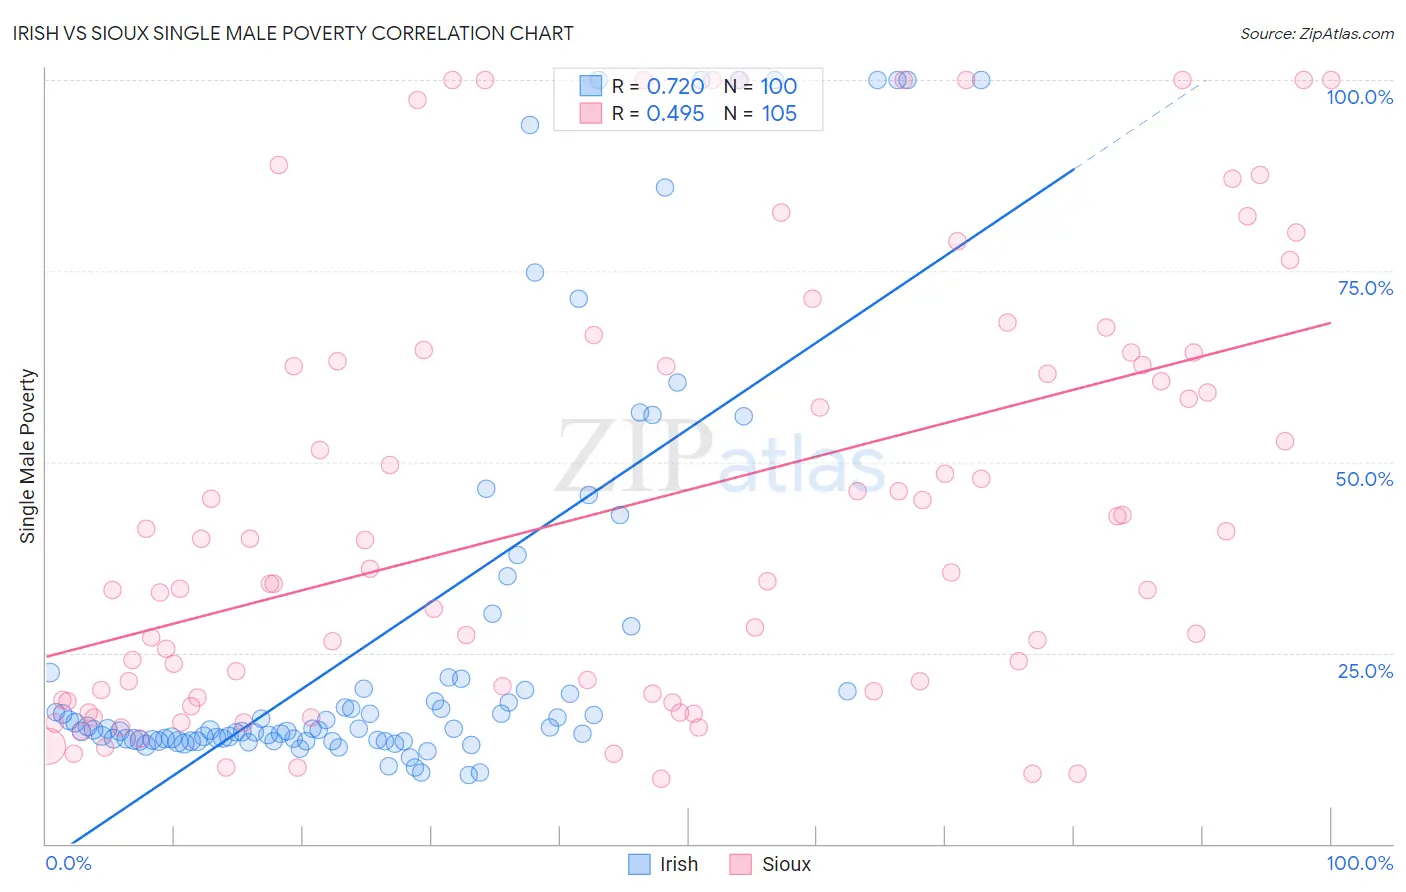
Irish vs Sioux Single Male Poverty Correlation Chart
The statistical analysis conducted on geographies consisting of 475,678,020 people shows a strong positive correlation between the proportion of Irish and poverty level among single males in the United States with a correlation coefficient (R) of 0.720 and weighted average of 14.0%. Similarly, the statistical analysis conducted on geographies consisting of 217,135,465 people shows a moderate positive correlation between the proportion of Sioux and poverty level among single males in the United States with a correlation coefficient (R) of 0.495 and weighted average of 22.2%, a difference of 58.9%.
Single Male Poverty Correlation Summary
| Measurement | Irish | Sioux |
| Minimum | 9.0% | 8.6% |
| Maximum | 100.0% | 100.0% |
| Range | 91.0% | 91.4% |
| Mean | 27.7% | 44.2% |
| Median | 15.0% | 35.5% |
| Interquartile 25% (IQ1) | 13.6% | 19.4% |
| Interquartile 75% (IQ3) | 21.6% | 63.7% |
| Interquartile Range (IQR) | 8.1% | 44.3% |
| Standard Deviation (Sample) | 26.9% | 28.5% |
| Standard Deviation (Population) | 26.8% | 28.4% |
Similar Demographics by Single Male Poverty
Demographics Similar to Irish by Single Male Poverty
In terms of single male poverty, the demographic groups most similar to Irish are Immigrants from Saudi Arabia (14.0%, a difference of 0.030%), Scottish (14.0%, a difference of 0.040%), Mexican (14.0%, a difference of 0.060%), Immigrants from Mexico (13.9%, a difference of 0.20%), and German (13.9%, a difference of 0.27%).
| Demographics | Rating | Rank | Single Male Poverty |
| West Indians | 0.2 /100 | #264 | Tragic 13.8% |
| Immigrants | Congo | 0.2 /100 | #265 | Tragic 13.9% |
| Immigrants | Cabo Verde | 0.1 /100 | #266 | Tragic 13.9% |
| Germans | 0.1 /100 | #267 | Tragic 13.9% |
| Immigrants | Mexico | 0.1 /100 | #268 | Tragic 13.9% |
| Scottish | 0.1 /100 | #269 | Tragic 14.0% |
| Immigrants | Saudi Arabia | 0.1 /100 | #270 | Tragic 14.0% |
| Irish | 0.1 /100 | #271 | Tragic 14.0% |
| Mexicans | 0.1 /100 | #272 | Tragic 14.0% |
| Welsh | 0.1 /100 | #273 | Tragic 14.0% |
| Hondurans | 0.1 /100 | #274 | Tragic 14.0% |
| English | 0.1 /100 | #275 | Tragic 14.1% |
| Dutch | 0.1 /100 | #276 | Tragic 14.1% |
| Immigrants | Honduras | 0.0 /100 | #277 | Tragic 14.1% |
| Slovaks | 0.0 /100 | #278 | Tragic 14.1% |
Demographics Similar to Sioux by Single Male Poverty
In terms of single male poverty, the demographic groups most similar to Sioux are Arapaho (21.9%, a difference of 1.3%), Pueblo (21.6%, a difference of 2.8%), Apache (21.6%, a difference of 2.9%), Tohono O'odham (21.6%, a difference of 3.1%), and Yuman (21.3%, a difference of 4.3%).
| Demographics | Rating | Rank | Single Male Poverty |
| Inupiat | 0.0 /100 | #333 | Tragic 20.0% |
| Pima | 0.0 /100 | #334 | Tragic 20.2% |
| Yuman | 0.0 /100 | #335 | Tragic 21.3% |
| Tohono O'odham | 0.0 /100 | #336 | Tragic 21.6% |
| Apache | 0.0 /100 | #337 | Tragic 21.6% |
| Pueblo | 0.0 /100 | #338 | Tragic 21.6% |
| Arapaho | 0.0 /100 | #339 | Tragic 21.9% |
| Sioux | 0.0 /100 | #340 | Tragic 22.2% |
| Crow | 0.0 /100 | #341 | Tragic 23.3% |
| Houma | 0.0 /100 | #342 | Tragic 23.5% |
| Puerto Ricans | 0.0 /100 | #343 | Tragic 25.1% |
| Lumbee | 0.0 /100 | #344 | Tragic 25.2% |
| Navajo | 0.0 /100 | #345 | Tragic 25.3% |
| Hopi | 0.0 /100 | #346 | Tragic 27.5% |
| Yup'ik | 0.0 /100 | #347 | Tragic 31.6% |