Liberian vs Immigrants from St. Vincent and the Grenadines Female Poverty
COMPARE
Liberian
Immigrants from St. Vincent and the Grenadines
Female Poverty
Female Poverty Comparison
Liberians
Immigrants from St. Vincent and the Grenadines
15.4%
FEMALE POVERTY
0.2/ 100
METRIC RATING
253rd/ 347
METRIC RANK
15.9%
FEMALE POVERTY
0.0/ 100
METRIC RATING
271st/ 347
METRIC RANK
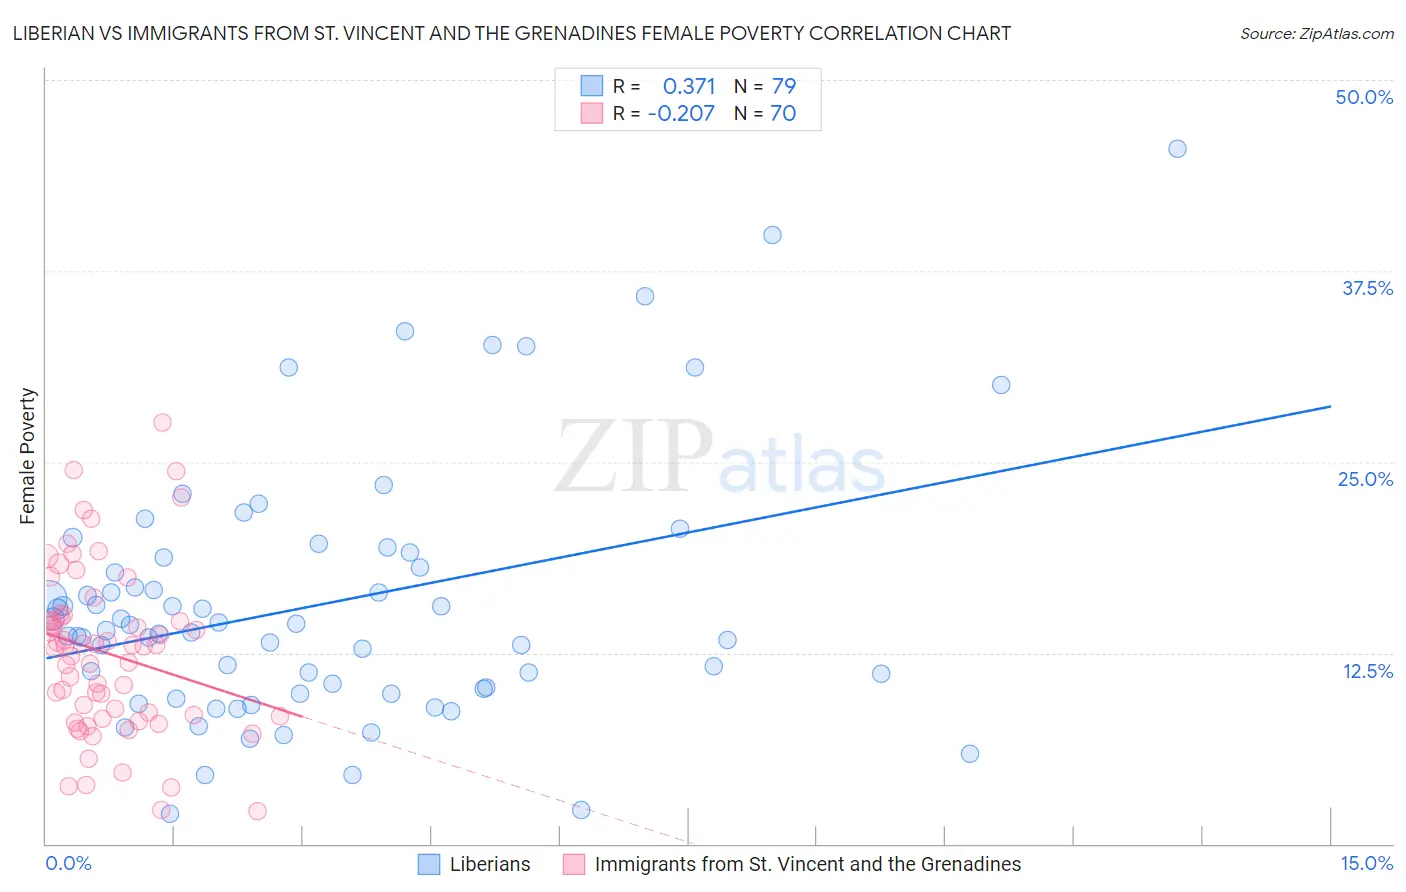
Liberian vs Immigrants from St. Vincent and the Grenadines Female Poverty Correlation Chart
The statistical analysis conducted on geographies consisting of 118,038,056 people shows a mild positive correlation between the proportion of Liberians and poverty level among females in the United States with a correlation coefficient (R) of 0.371 and weighted average of 15.4%. Similarly, the statistical analysis conducted on geographies consisting of 56,090,975 people shows a weak negative correlation between the proportion of Immigrants from St. Vincent and the Grenadines and poverty level among females in the United States with a correlation coefficient (R) of -0.207 and weighted average of 15.9%, a difference of 3.3%.
Female Poverty Correlation Summary
| Measurement | Liberian | Immigrants from St. Vincent and the Grenadines |
| Minimum | 1.9% | 2.1% |
| Maximum | 45.5% | 27.6% |
| Range | 43.6% | 25.5% |
| Mean | 15.7% | 12.5% |
| Median | 14.0% | 13.0% |
| Interquartile 25% (IQ1) | 10.2% | 8.3% |
| Interquartile 75% (IQ3) | 18.8% | 14.8% |
| Interquartile Range (IQR) | 8.6% | 6.5% |
| Standard Deviation (Sample) | 8.4% | 5.4% |
| Standard Deviation (Population) | 8.3% | 5.4% |
Demographics Similar to Liberians and Immigrants from St. Vincent and the Grenadines by Female Poverty
In terms of female poverty, the demographic groups most similar to Liberians are Trinidadian and Tobagonian (15.4%, a difference of 0.24%), Immigrants from Burma/Myanmar (15.4%, a difference of 0.26%), Ottawa (15.5%, a difference of 0.54%), Jamaican (15.5%, a difference of 0.85%), and Immigrants from Jamaica (15.6%, a difference of 0.98%). Similarly, the demographic groups most similar to Immigrants from St. Vincent and the Grenadines are Belizean (15.9%, a difference of 0.23%), Chickasaw (15.9%, a difference of 0.28%), Iroquois (15.8%, a difference of 0.54%), Immigrants from Nicaragua (15.8%, a difference of 0.90%), and Subsaharan African (15.8%, a difference of 0.97%).
| Demographics | Rating | Rank | Female Poverty |
| Immigrants | Burma/Myanmar | 0.3 /100 | #252 | Tragic 15.4% |
| Liberians | 0.2 /100 | #253 | Tragic 15.4% |
| Trinidadians and Tobagonians | 0.2 /100 | #254 | Tragic 15.4% |
| Ottawa | 0.2 /100 | #255 | Tragic 15.5% |
| Jamaicans | 0.2 /100 | #256 | Tragic 15.5% |
| Immigrants | Jamaica | 0.1 /100 | #257 | Tragic 15.6% |
| Shoshone | 0.1 /100 | #258 | Tragic 15.6% |
| Cape Verdeans | 0.1 /100 | #259 | Tragic 15.6% |
| Immigrants | Guyana | 0.1 /100 | #260 | Tragic 15.6% |
| Guyanese | 0.1 /100 | #261 | Tragic 15.6% |
| Mexican American Indians | 0.1 /100 | #262 | Tragic 15.6% |
| Cherokee | 0.1 /100 | #263 | Tragic 15.6% |
| Immigrants | Ecuador | 0.1 /100 | #264 | Tragic 15.6% |
| Immigrants | Liberia | 0.1 /100 | #265 | Tragic 15.7% |
| Immigrants | El Salvador | 0.1 /100 | #266 | Tragic 15.7% |
| Sub-Saharan Africans | 0.1 /100 | #267 | Tragic 15.8% |
| Immigrants | Nicaragua | 0.1 /100 | #268 | Tragic 15.8% |
| Iroquois | 0.1 /100 | #269 | Tragic 15.8% |
| Chickasaw | 0.1 /100 | #270 | Tragic 15.9% |
| Immigrants | St. Vincent and the Grenadines | 0.0 /100 | #271 | Tragic 15.9% |
| Belizeans | 0.0 /100 | #272 | Tragic 15.9% |