Liberian vs Central American Indian In Labor Force | Age 35-44
COMPARE
Liberian
Central American Indian
In Labor Force | Age 35-44
In Labor Force | Age 35-44 Comparison
Liberians
Central American Indians
85.7%
IN LABOR FORCE | AGE 35-44
100.0/ 100
METRIC RATING
12th/ 347
METRIC RANK
82.5%
IN LABOR FORCE | AGE 35-44
0.0/ 100
METRIC RATING
300th/ 347
METRIC RANK
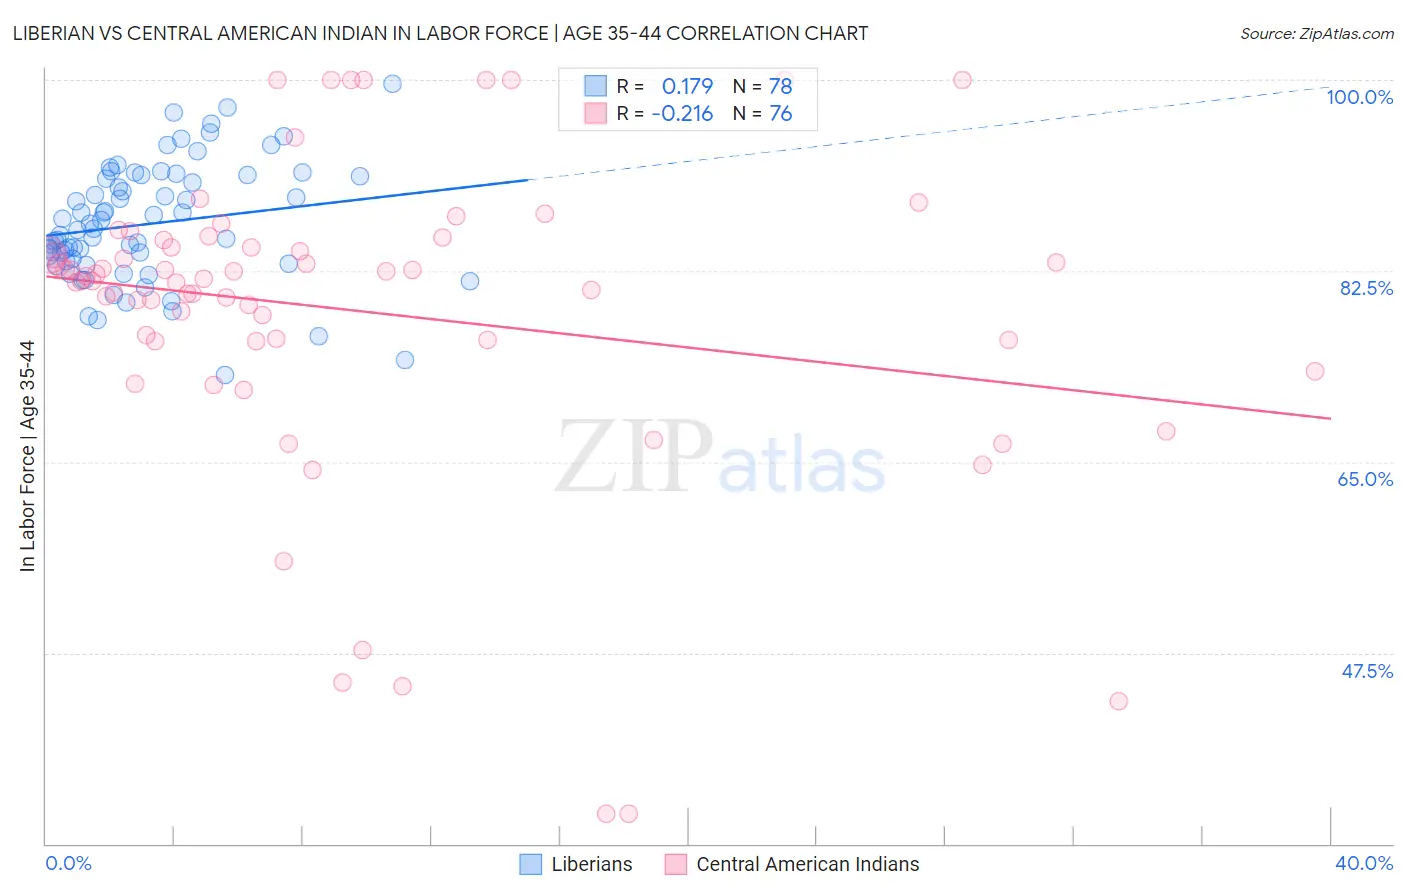
Liberian vs Central American Indian In Labor Force | Age 35-44 Correlation Chart
The statistical analysis conducted on geographies consisting of 118,044,655 people shows a poor positive correlation between the proportion of Liberians and labor force participation rate among population between the ages 35 and 44 in the United States with a correlation coefficient (R) of 0.179 and weighted average of 85.7%. Similarly, the statistical analysis conducted on geographies consisting of 326,103,474 people shows a weak negative correlation between the proportion of Central American Indians and labor force participation rate among population between the ages 35 and 44 in the United States with a correlation coefficient (R) of -0.216 and weighted average of 82.5%, a difference of 3.8%.
In Labor Force | Age 35-44 Correlation Summary
| Measurement | Liberian | Central American Indian |
| Minimum | 73.0% | 32.8% |
| Maximum | 99.7% | 100.0% |
| Range | 26.7% | 67.2% |
| Mean | 86.8% | 78.8% |
| Median | 86.3% | 81.7% |
| Interquartile 25% (IQ1) | 83.4% | 76.1% |
| Interquartile 75% (IQ3) | 91.2% | 85.0% |
| Interquartile Range (IQR) | 7.8% | 8.9% |
| Standard Deviation (Sample) | 5.4% | 14.3% |
| Standard Deviation (Population) | 5.4% | 14.3% |
Similar Demographics by In Labor Force | Age 35-44
Demographics Similar to Liberians by In Labor Force | Age 35-44
In terms of in labor force | age 35-44, the demographic groups most similar to Liberians are Somali (85.6%, a difference of 0.020%), Immigrants from Somalia (85.6%, a difference of 0.020%), Norwegian (85.6%, a difference of 0.060%), Immigrants from Ireland (85.6%, a difference of 0.060%), and Immigrants from North Macedonia (85.6%, a difference of 0.11%).
| Demographics | Rating | Rank | In Labor Force | Age 35-44 |
| Zimbabweans | 100.0 /100 | #5 | Exceptional 86.1% |
| Bolivians | 100.0 /100 | #6 | Exceptional 86.1% |
| Immigrants | Sierra Leone | 100.0 /100 | #7 | Exceptional 86.1% |
| Immigrants | Ethiopia | 100.0 /100 | #8 | Exceptional 85.9% |
| Ethiopians | 100.0 /100 | #9 | Exceptional 85.9% |
| Cape Verdeans | 100.0 /100 | #10 | Exceptional 85.8% |
| Immigrants | Cameroon | 100.0 /100 | #11 | Exceptional 85.8% |
| Liberians | 100.0 /100 | #12 | Exceptional 85.7% |
| Somalis | 100.0 /100 | #13 | Exceptional 85.6% |
| Immigrants | Somalia | 100.0 /100 | #14 | Exceptional 85.6% |
| Norwegians | 100.0 /100 | #15 | Exceptional 85.6% |
| Immigrants | Ireland | 100.0 /100 | #16 | Exceptional 85.6% |
| Immigrants | North Macedonia | 100.0 /100 | #17 | Exceptional 85.6% |
| Carpatho Rusyns | 100.0 /100 | #18 | Exceptional 85.6% |
| Slovenes | 100.0 /100 | #19 | Exceptional 85.6% |
Demographics Similar to Central American Indians by In Labor Force | Age 35-44
In terms of in labor force | age 35-44, the demographic groups most similar to Central American Indians are Spanish American Indian (82.5%, a difference of 0.020%), Tlingit-Haida (82.5%, a difference of 0.070%), Ottawa (82.6%, a difference of 0.080%), Hmong (82.6%, a difference of 0.090%), and Mexican American Indian (82.6%, a difference of 0.10%).
| Demographics | Rating | Rank | In Labor Force | Age 35-44 |
| Spanish Americans | 0.0 /100 | #293 | Tragic 82.8% |
| Potawatomi | 0.0 /100 | #294 | Tragic 82.7% |
| Immigrants | Lebanon | 0.0 /100 | #295 | Tragic 82.7% |
| Mexican American Indians | 0.0 /100 | #296 | Tragic 82.6% |
| Hmong | 0.0 /100 | #297 | Tragic 82.6% |
| Ottawa | 0.0 /100 | #298 | Tragic 82.6% |
| Tlingit-Haida | 0.0 /100 | #299 | Tragic 82.5% |
| Central American Indians | 0.0 /100 | #300 | Tragic 82.5% |
| Spanish American Indians | 0.0 /100 | #301 | Tragic 82.5% |
| Americans | 0.0 /100 | #302 | Tragic 82.4% |
| Nepalese | 0.0 /100 | #303 | Tragic 82.4% |
| Marshallese | 0.0 /100 | #304 | Tragic 82.4% |
| Shoshone | 0.0 /100 | #305 | Tragic 82.2% |
| Blacks/African Americans | 0.0 /100 | #306 | Tragic 82.2% |
| Hispanics or Latinos | 0.0 /100 | #307 | Tragic 82.1% |