Lebanese vs Fijian Single Mother Poverty
COMPARE
Lebanese
Fijian
Single Mother Poverty
Single Mother Poverty Comparison
Lebanese
Fijians
29.4%
SINGLE MOTHER POVERTY
32.5/ 100
METRIC RATING
187th/ 347
METRIC RANK
31.6%
SINGLE MOTHER POVERTY
0.1/ 100
METRIC RATING
273rd/ 347
METRIC RANK
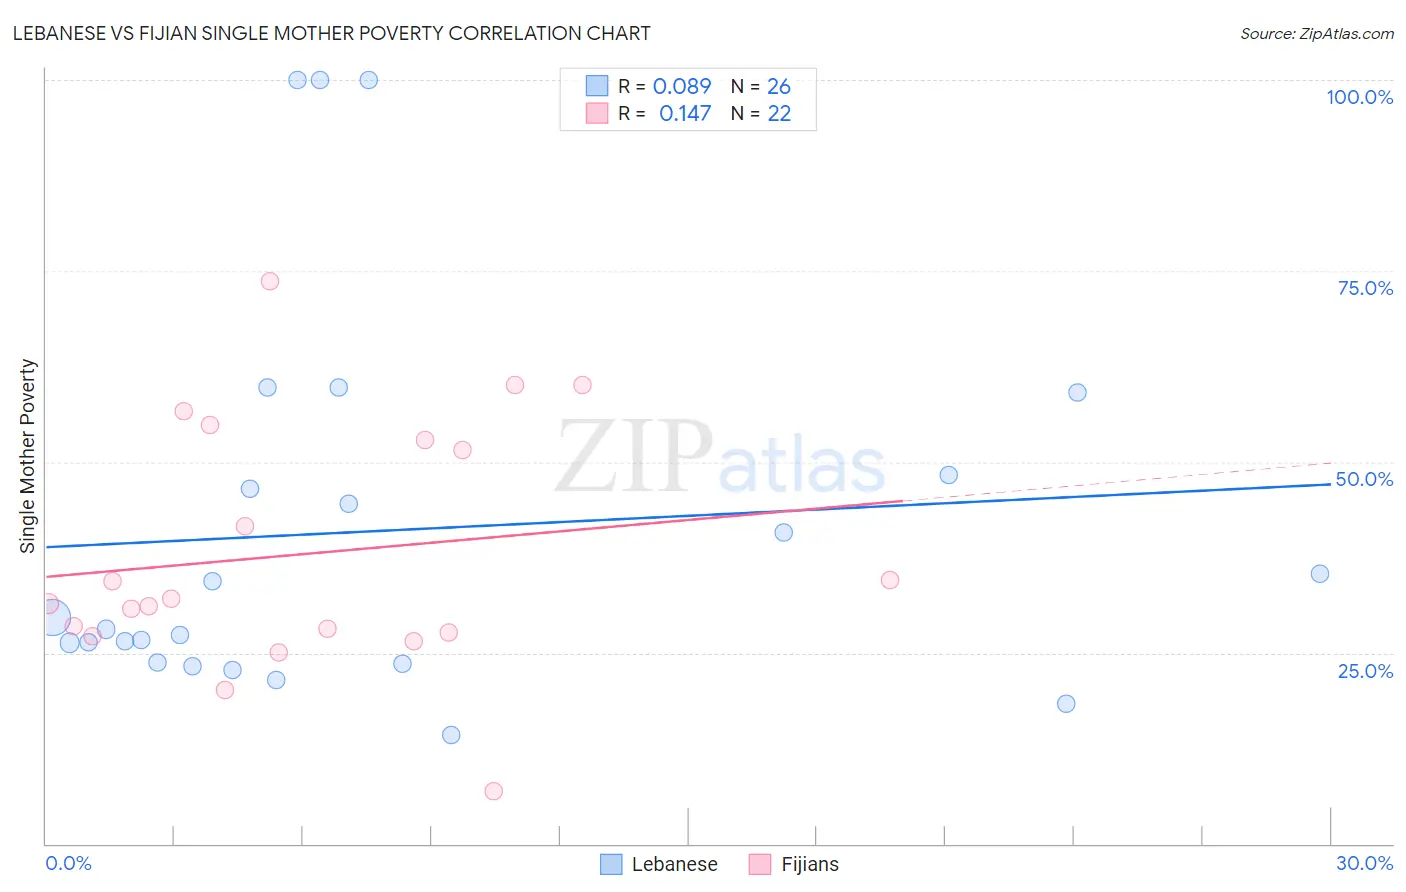
Lebanese vs Fijian Single Mother Poverty Correlation Chart
The statistical analysis conducted on geographies consisting of 390,539,511 people shows a slight positive correlation between the proportion of Lebanese and poverty level among single mothers in the United States with a correlation coefficient (R) of 0.089 and weighted average of 29.4%. Similarly, the statistical analysis conducted on geographies consisting of 55,870,068 people shows a poor positive correlation between the proportion of Fijians and poverty level among single mothers in the United States with a correlation coefficient (R) of 0.147 and weighted average of 31.6%, a difference of 7.6%.
Single Mother Poverty Correlation Summary
| Measurement | Lebanese | Fijian |
| Minimum | 14.3% | 6.9% |
| Maximum | 100.0% | 73.6% |
| Range | 85.7% | 66.7% |
| Mean | 41.0% | 38.0% |
| Median | 28.9% | 31.8% |
| Interquartile 25% (IQ1) | 23.8% | 27.7% |
| Interquartile 75% (IQ3) | 48.2% | 52.9% |
| Interquartile Range (IQR) | 24.4% | 25.1% |
| Standard Deviation (Sample) | 25.2% | 16.2% |
| Standard Deviation (Population) | 24.7% | 15.8% |
Similar Demographics by Single Mother Poverty
Demographics Similar to Lebanese by Single Mother Poverty
In terms of single mother poverty, the demographic groups most similar to Lebanese are Guamanian/Chamorro (29.4%, a difference of 0.040%), Immigrants from Africa (29.4%, a difference of 0.050%), Immigrants from Germany (29.5%, a difference of 0.11%), Immigrants from Trinidad and Tobago (29.5%, a difference of 0.18%), and Yugoslavian (29.4%, a difference of 0.19%).
| Demographics | Rating | Rank | Single Mother Poverty |
| Immigrants | Norway | 41.5 /100 | #180 | Average 29.3% |
| Canadians | 40.4 /100 | #181 | Average 29.3% |
| Immigrants | Eastern Africa | 38.5 /100 | #182 | Fair 29.3% |
| Nepalese | 38.3 /100 | #183 | Fair 29.3% |
| Nigerians | 38.0 /100 | #184 | Fair 29.3% |
| Ghanaians | 36.8 /100 | #185 | Fair 29.4% |
| Yugoslavians | 36.0 /100 | #186 | Fair 29.4% |
| Lebanese | 32.5 /100 | #187 | Fair 29.4% |
| Guamanians/Chamorros | 31.8 /100 | #188 | Fair 29.4% |
| Immigrants | Africa | 31.6 /100 | #189 | Fair 29.4% |
| Immigrants | Germany | 30.4 /100 | #190 | Fair 29.5% |
| Immigrants | Trinidad and Tobago | 29.2 /100 | #191 | Fair 29.5% |
| Moroccans | 28.6 /100 | #192 | Fair 29.5% |
| Basques | 28.3 /100 | #193 | Fair 29.5% |
| Icelanders | 26.1 /100 | #194 | Fair 29.5% |
Demographics Similar to Fijians by Single Mother Poverty
In terms of single mother poverty, the demographic groups most similar to Fijians are Immigrants from Micronesia (31.6%, a difference of 0.23%), Bangladeshi (31.7%, a difference of 0.23%), Immigrants from Cabo Verde (31.6%, a difference of 0.25%), Central American (31.8%, a difference of 0.42%), and British West Indian (31.5%, a difference of 0.49%).
| Demographics | Rating | Rank | Single Mother Poverty |
| Sub-Saharan Africans | 0.2 /100 | #266 | Tragic 31.4% |
| Immigrants | Belize | 0.2 /100 | #267 | Tragic 31.4% |
| Immigrants | Senegal | 0.1 /100 | #268 | Tragic 31.5% |
| Scotch-Irish | 0.1 /100 | #269 | Tragic 31.5% |
| British West Indians | 0.1 /100 | #270 | Tragic 31.5% |
| Immigrants | Cabo Verde | 0.1 /100 | #271 | Tragic 31.6% |
| Immigrants | Micronesia | 0.1 /100 | #272 | Tragic 31.6% |
| Fijians | 0.1 /100 | #273 | Tragic 31.6% |
| Bangladeshis | 0.1 /100 | #274 | Tragic 31.7% |
| Central Americans | 0.1 /100 | #275 | Tragic 31.8% |
| Delaware | 0.0 /100 | #276 | Tragic 31.8% |
| Mexican American Indians | 0.0 /100 | #277 | Tragic 31.9% |
| Immigrants | Zaire | 0.0 /100 | #278 | Tragic 32.0% |
| Marshallese | 0.0 /100 | #279 | Tragic 32.1% |
| Immigrants | Nonimmigrants | 0.0 /100 | #280 | Tragic 32.2% |