Lebanese vs Immigrants from Hong Kong Single Mother Poverty
COMPARE
Lebanese
Immigrants from Hong Kong
Single Mother Poverty
Single Mother Poverty Comparison
Lebanese
Immigrants from Hong Kong
29.4%
SINGLE MOTHER POVERTY
32.5/ 100
METRIC RATING
187th/ 347
METRIC RANK
24.4%
SINGLE MOTHER POVERTY
100.0/ 100
METRIC RATING
5th/ 347
METRIC RANK
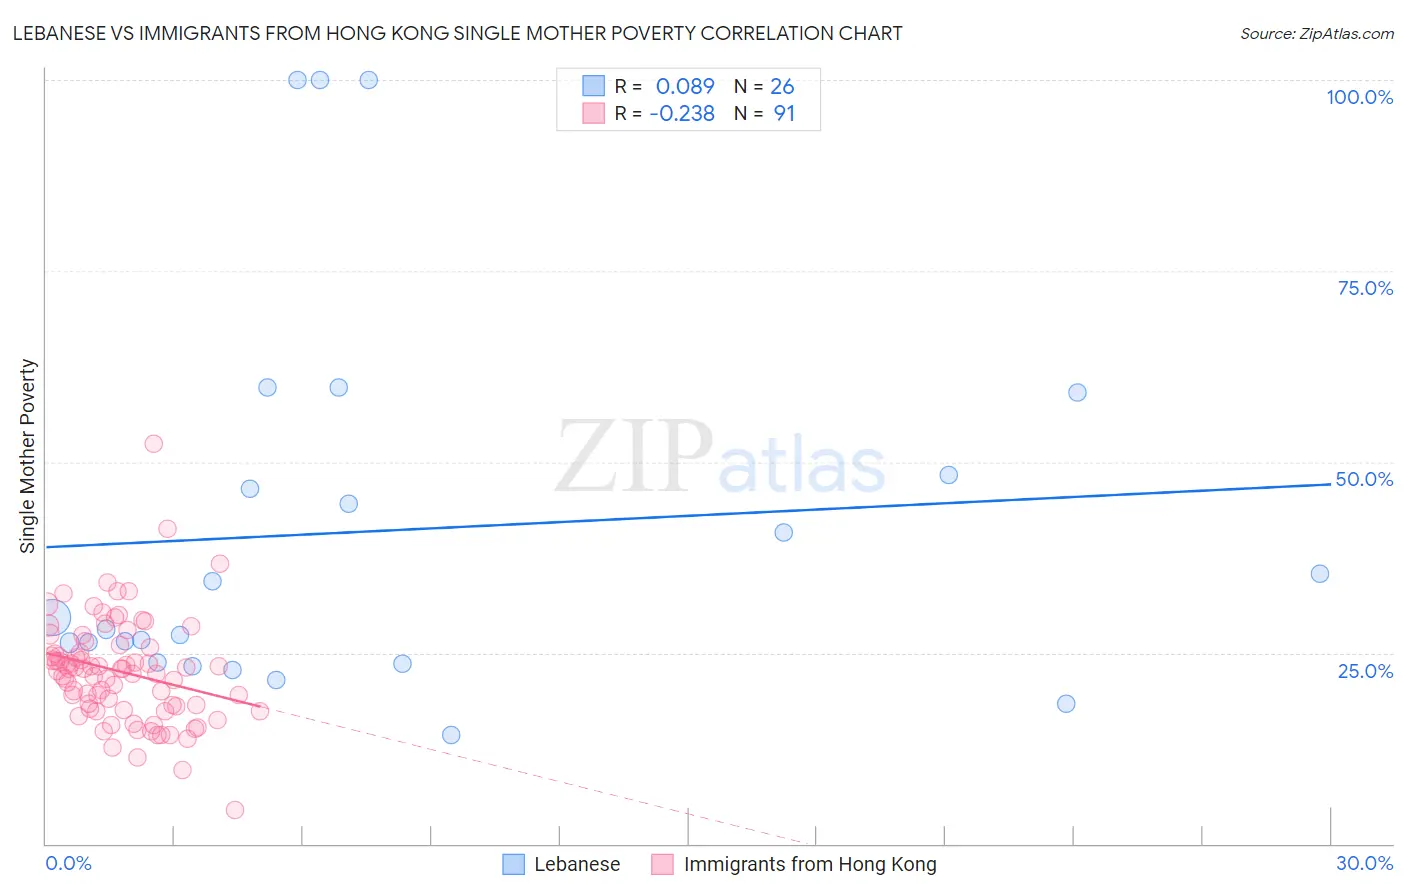
Lebanese vs Immigrants from Hong Kong Single Mother Poverty Correlation Chart
The statistical analysis conducted on geographies consisting of 390,539,511 people shows a slight positive correlation between the proportion of Lebanese and poverty level among single mothers in the United States with a correlation coefficient (R) of 0.089 and weighted average of 29.4%. Similarly, the statistical analysis conducted on geographies consisting of 248,457,353 people shows a weak negative correlation between the proportion of Immigrants from Hong Kong and poverty level among single mothers in the United States with a correlation coefficient (R) of -0.238 and weighted average of 24.4%, a difference of 20.7%.
Single Mother Poverty Correlation Summary
| Measurement | Lebanese | Immigrants from Hong Kong |
| Minimum | 14.3% | 4.5% |
| Maximum | 100.0% | 52.3% |
| Range | 85.7% | 47.8% |
| Mean | 41.0% | 22.5% |
| Median | 28.9% | 22.9% |
| Interquartile 25% (IQ1) | 23.8% | 17.7% |
| Interquartile 75% (IQ3) | 48.2% | 25.6% |
| Interquartile Range (IQR) | 24.4% | 7.9% |
| Standard Deviation (Sample) | 25.2% | 7.0% |
| Standard Deviation (Population) | 24.7% | 6.9% |
Similar Demographics by Single Mother Poverty
Demographics Similar to Lebanese by Single Mother Poverty
In terms of single mother poverty, the demographic groups most similar to Lebanese are Guamanian/Chamorro (29.4%, a difference of 0.040%), Immigrants from Africa (29.4%, a difference of 0.050%), Immigrants from Germany (29.5%, a difference of 0.11%), Immigrants from Trinidad and Tobago (29.5%, a difference of 0.18%), and Yugoslavian (29.4%, a difference of 0.19%).
| Demographics | Rating | Rank | Single Mother Poverty |
| Immigrants | Norway | 41.5 /100 | #180 | Average 29.3% |
| Canadians | 40.4 /100 | #181 | Average 29.3% |
| Immigrants | Eastern Africa | 38.5 /100 | #182 | Fair 29.3% |
| Nepalese | 38.3 /100 | #183 | Fair 29.3% |
| Nigerians | 38.0 /100 | #184 | Fair 29.3% |
| Ghanaians | 36.8 /100 | #185 | Fair 29.4% |
| Yugoslavians | 36.0 /100 | #186 | Fair 29.4% |
| Lebanese | 32.5 /100 | #187 | Fair 29.4% |
| Guamanians/Chamorros | 31.8 /100 | #188 | Fair 29.4% |
| Immigrants | Africa | 31.6 /100 | #189 | Fair 29.4% |
| Immigrants | Germany | 30.4 /100 | #190 | Fair 29.5% |
| Immigrants | Trinidad and Tobago | 29.2 /100 | #191 | Fair 29.5% |
| Moroccans | 28.6 /100 | #192 | Fair 29.5% |
| Basques | 28.3 /100 | #193 | Fair 29.5% |
| Icelanders | 26.1 /100 | #194 | Fair 29.5% |
Demographics Similar to Immigrants from Hong Kong by Single Mother Poverty
In terms of single mother poverty, the demographic groups most similar to Immigrants from Hong Kong are Filipino (24.3%, a difference of 0.23%), Thai (24.5%, a difference of 0.49%), Chinese (24.6%, a difference of 1.0%), Immigrants from Taiwan (23.9%, a difference of 2.1%), and Immigrants from India (23.8%, a difference of 2.4%).
| Demographics | Rating | Rank | Single Mother Poverty |
| Assyrians/Chaldeans/Syriacs | 100.0 /100 | #1 | Exceptional 23.8% |
| Immigrants | India | 100.0 /100 | #2 | Exceptional 23.8% |
| Immigrants | Taiwan | 100.0 /100 | #3 | Exceptional 23.9% |
| Filipinos | 100.0 /100 | #4 | Exceptional 24.3% |
| Immigrants | Hong Kong | 100.0 /100 | #5 | Exceptional 24.4% |
| Thais | 100.0 /100 | #6 | Exceptional 24.5% |
| Chinese | 100.0 /100 | #7 | Exceptional 24.6% |
| Immigrants | Iran | 100.0 /100 | #8 | Exceptional 25.1% |
| Immigrants | Lithuania | 100.0 /100 | #9 | Exceptional 25.2% |
| Immigrants | South Central Asia | 100.0 /100 | #10 | Exceptional 25.3% |
| Iranians | 100.0 /100 | #11 | Exceptional 25.5% |
| Bhutanese | 100.0 /100 | #12 | Exceptional 25.6% |
| Indians (Asian) | 100.0 /100 | #13 | Exceptional 25.8% |
| Immigrants | Singapore | 100.0 /100 | #14 | Exceptional 25.8% |
| Immigrants | Ireland | 100.0 /100 | #15 | Exceptional 25.8% |