Lebanese vs Immigrants from Cabo Verde Single Mother Poverty
COMPARE
Lebanese
Immigrants from Cabo Verde
Single Mother Poverty
Single Mother Poverty Comparison
Lebanese
Immigrants from Cabo Verde
29.4%
SINGLE MOTHER POVERTY
32.5/ 100
METRIC RATING
187th/ 347
METRIC RANK
31.6%
SINGLE MOTHER POVERTY
0.1/ 100
METRIC RATING
271st/ 347
METRIC RANK
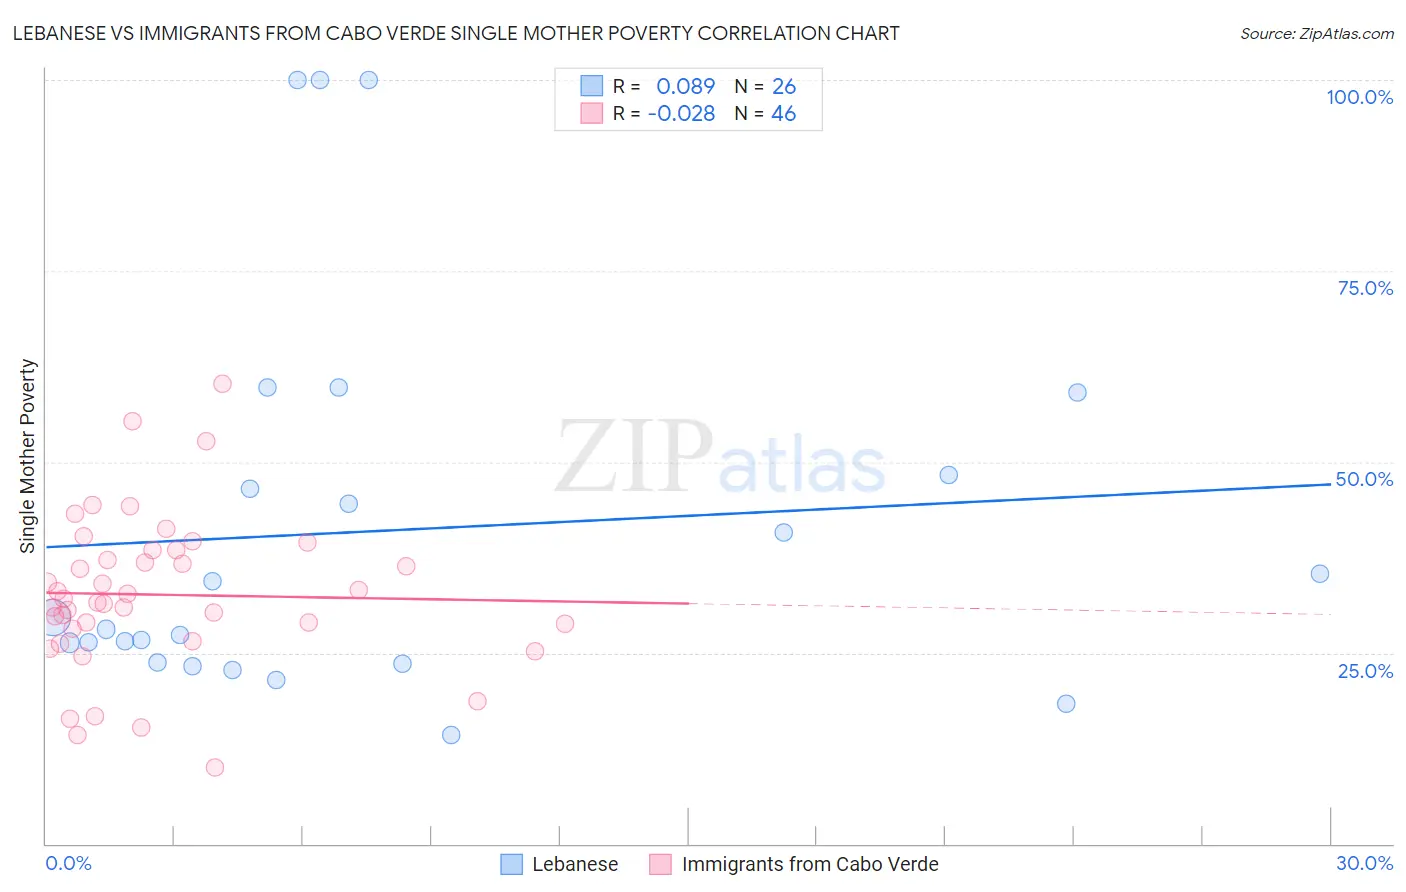
Lebanese vs Immigrants from Cabo Verde Single Mother Poverty Correlation Chart
The statistical analysis conducted on geographies consisting of 390,539,511 people shows a slight positive correlation between the proportion of Lebanese and poverty level among single mothers in the United States with a correlation coefficient (R) of 0.089 and weighted average of 29.4%. Similarly, the statistical analysis conducted on geographies consisting of 37,815,168 people shows no correlation between the proportion of Immigrants from Cabo Verde and poverty level among single mothers in the United States with a correlation coefficient (R) of -0.028 and weighted average of 31.6%, a difference of 7.3%.
Single Mother Poverty Correlation Summary
| Measurement | Lebanese | Immigrants from Cabo Verde |
| Minimum | 14.3% | 9.9% |
| Maximum | 100.0% | 60.3% |
| Range | 85.7% | 50.4% |
| Mean | 41.0% | 32.6% |
| Median | 28.9% | 31.8% |
| Interquartile 25% (IQ1) | 23.8% | 28.1% |
| Interquartile 75% (IQ3) | 48.2% | 38.4% |
| Interquartile Range (IQR) | 24.4% | 10.3% |
| Standard Deviation (Sample) | 25.2% | 10.2% |
| Standard Deviation (Population) | 24.7% | 10.1% |
Similar Demographics by Single Mother Poverty
Demographics Similar to Lebanese by Single Mother Poverty
In terms of single mother poverty, the demographic groups most similar to Lebanese are Guamanian/Chamorro (29.4%, a difference of 0.040%), Immigrants from Africa (29.4%, a difference of 0.050%), Immigrants from Germany (29.5%, a difference of 0.11%), Immigrants from Trinidad and Tobago (29.5%, a difference of 0.18%), and Yugoslavian (29.4%, a difference of 0.19%).
| Demographics | Rating | Rank | Single Mother Poverty |
| Immigrants | Norway | 41.5 /100 | #180 | Average 29.3% |
| Canadians | 40.4 /100 | #181 | Average 29.3% |
| Immigrants | Eastern Africa | 38.5 /100 | #182 | Fair 29.3% |
| Nepalese | 38.3 /100 | #183 | Fair 29.3% |
| Nigerians | 38.0 /100 | #184 | Fair 29.3% |
| Ghanaians | 36.8 /100 | #185 | Fair 29.4% |
| Yugoslavians | 36.0 /100 | #186 | Fair 29.4% |
| Lebanese | 32.5 /100 | #187 | Fair 29.4% |
| Guamanians/Chamorros | 31.8 /100 | #188 | Fair 29.4% |
| Immigrants | Africa | 31.6 /100 | #189 | Fair 29.4% |
| Immigrants | Germany | 30.4 /100 | #190 | Fair 29.5% |
| Immigrants | Trinidad and Tobago | 29.2 /100 | #191 | Fair 29.5% |
| Moroccans | 28.6 /100 | #192 | Fair 29.5% |
| Basques | 28.3 /100 | #193 | Fair 29.5% |
| Icelanders | 26.1 /100 | #194 | Fair 29.5% |
Demographics Similar to Immigrants from Cabo Verde by Single Mother Poverty
In terms of single mother poverty, the demographic groups most similar to Immigrants from Cabo Verde are Immigrants from Micronesia (31.6%, a difference of 0.010%), British West Indian (31.5%, a difference of 0.24%), Fijian (31.6%, a difference of 0.25%), Scotch-Irish (31.5%, a difference of 0.29%), and Immigrants from Senegal (31.5%, a difference of 0.33%).
| Demographics | Rating | Rank | Single Mother Poverty |
| Immigrants | Ecuador | 0.2 /100 | #264 | Tragic 31.3% |
| German Russians | 0.2 /100 | #265 | Tragic 31.3% |
| Sub-Saharan Africans | 0.2 /100 | #266 | Tragic 31.4% |
| Immigrants | Belize | 0.2 /100 | #267 | Tragic 31.4% |
| Immigrants | Senegal | 0.1 /100 | #268 | Tragic 31.5% |
| Scotch-Irish | 0.1 /100 | #269 | Tragic 31.5% |
| British West Indians | 0.1 /100 | #270 | Tragic 31.5% |
| Immigrants | Cabo Verde | 0.1 /100 | #271 | Tragic 31.6% |
| Immigrants | Micronesia | 0.1 /100 | #272 | Tragic 31.6% |
| Fijians | 0.1 /100 | #273 | Tragic 31.6% |
| Bangladeshis | 0.1 /100 | #274 | Tragic 31.7% |
| Central Americans | 0.1 /100 | #275 | Tragic 31.8% |
| Delaware | 0.0 /100 | #276 | Tragic 31.8% |
| Mexican American Indians | 0.0 /100 | #277 | Tragic 31.9% |
| Immigrants | Zaire | 0.0 /100 | #278 | Tragic 32.0% |