Lebanese vs Immigrants from Bulgaria 12th Grade, No Diploma
COMPARE
Lebanese
Immigrants from Bulgaria
12th Grade, No Diploma
12th Grade, No Diploma Comparison
Lebanese
Immigrants from Bulgaria
92.2%
12TH GRADE, NO DIPLOMA
97.6/ 100
METRIC RATING
104th/ 347
METRIC RANK
92.5%
12TH GRADE, NO DIPLOMA
99.1/ 100
METRIC RATING
84th/ 347
METRIC RANK
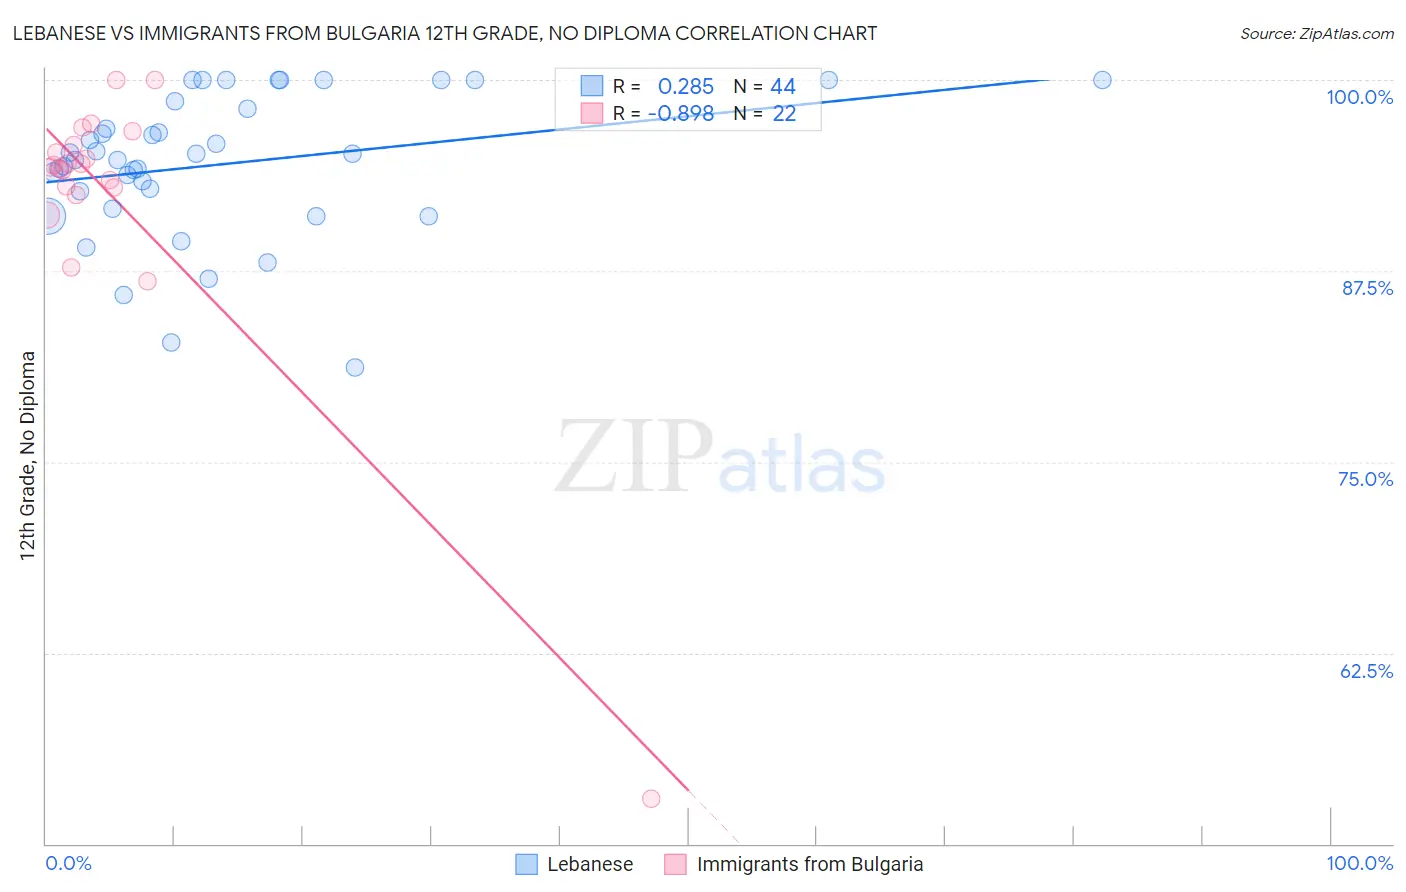
Lebanese vs Immigrants from Bulgaria 12th Grade, No Diploma Correlation Chart
The statistical analysis conducted on geographies consisting of 401,624,157 people shows a weak positive correlation between the proportion of Lebanese and percentage of population with at least 12th grade (no diploma) education in the United States with a correlation coefficient (R) of 0.285 and weighted average of 92.2%. Similarly, the statistical analysis conducted on geographies consisting of 172,552,181 people shows a very strong negative correlation between the proportion of Immigrants from Bulgaria and percentage of population with at least 12th grade (no diploma) education in the United States with a correlation coefficient (R) of -0.898 and weighted average of 92.5%, a difference of 0.30%.
12th Grade, No Diploma Correlation Summary
| Measurement | Lebanese | Immigrants from Bulgaria |
| Minimum | 81.2% | 52.9% |
| Maximum | 100.0% | 100.0% |
| Range | 18.8% | 47.1% |
| Mean | 94.5% | 92.4% |
| Median | 95.0% | 94.4% |
| Interquartile 25% (IQ1) | 92.1% | 93.0% |
| Interquartile 75% (IQ3) | 98.4% | 95.8% |
| Interquartile Range (IQR) | 6.3% | 2.8% |
| Standard Deviation (Sample) | 4.7% | 9.4% |
| Standard Deviation (Population) | 4.6% | 9.1% |
Demographics Similar to Lebanese and Immigrants from Bulgaria by 12th Grade, No Diploma
In terms of 12th grade, no diploma, the demographic groups most similar to Lebanese are Swiss (92.3%, a difference of 0.080%), Alaskan Athabascan (92.3%, a difference of 0.080%), Immigrants from Norway (92.3%, a difference of 0.080%), Immigrants from Croatia (92.3%, a difference of 0.11%), and Immigrants from Korea (92.3%, a difference of 0.12%). Similarly, the demographic groups most similar to Immigrants from Bulgaria are Immigrants from Saudi Arabia (92.5%, a difference of 0.020%), Immigrants from Turkey (92.4%, a difference of 0.060%), Immigrants from France (92.4%, a difference of 0.080%), Scotch-Irish (92.4%, a difference of 0.090%), and Canadian (92.4%, a difference of 0.11%).
| Demographics | Rating | Rank | 12th Grade, No Diploma |
| Immigrants | Bulgaria | 99.1 /100 | #84 | Exceptional 92.5% |
| Immigrants | Saudi Arabia | 99.0 /100 | #85 | Exceptional 92.5% |
| Immigrants | Turkey | 98.9 /100 | #86 | Exceptional 92.4% |
| Immigrants | France | 98.8 /100 | #87 | Exceptional 92.4% |
| Scotch-Irish | 98.8 /100 | #88 | Exceptional 92.4% |
| Canadians | 98.7 /100 | #89 | Exceptional 92.4% |
| Immigrants | Serbia | 98.6 /100 | #90 | Exceptional 92.4% |
| South Africans | 98.6 /100 | #91 | Exceptional 92.4% |
| Immigrants | Romania | 98.5 /100 | #92 | Exceptional 92.3% |
| Immigrants | Western Europe | 98.5 /100 | #93 | Exceptional 92.3% |
| Immigrants | Europe | 98.5 /100 | #94 | Exceptional 92.3% |
| Immigrants | North Macedonia | 98.5 /100 | #95 | Exceptional 92.3% |
| Icelanders | 98.5 /100 | #96 | Exceptional 92.3% |
| Celtics | 98.4 /100 | #97 | Exceptional 92.3% |
| Immigrants | Kuwait | 98.4 /100 | #98 | Exceptional 92.3% |
| Immigrants | Korea | 98.3 /100 | #99 | Exceptional 92.3% |
| Immigrants | Croatia | 98.3 /100 | #100 | Exceptional 92.3% |
| Swiss | 98.1 /100 | #101 | Exceptional 92.3% |
| Alaskan Athabascans | 98.1 /100 | #102 | Exceptional 92.3% |
| Immigrants | Norway | 98.1 /100 | #103 | Exceptional 92.3% |
| Lebanese | 97.6 /100 | #104 | Exceptional 92.2% |