Lebanese vs Immigrants from Bulgaria In Labor Force | Age 25-29
COMPARE
Lebanese
Immigrants from Bulgaria
In Labor Force | Age 25-29
In Labor Force | Age 25-29 Comparison
Lebanese
Immigrants from Bulgaria
84.3%
IN LABOR FORCE | AGE 25-29
11.1/ 100
METRIC RATING
214th/ 347
METRIC RANK
85.8%
IN LABOR FORCE | AGE 25-29
100.0/ 100
METRIC RATING
33rd/ 347
METRIC RANK
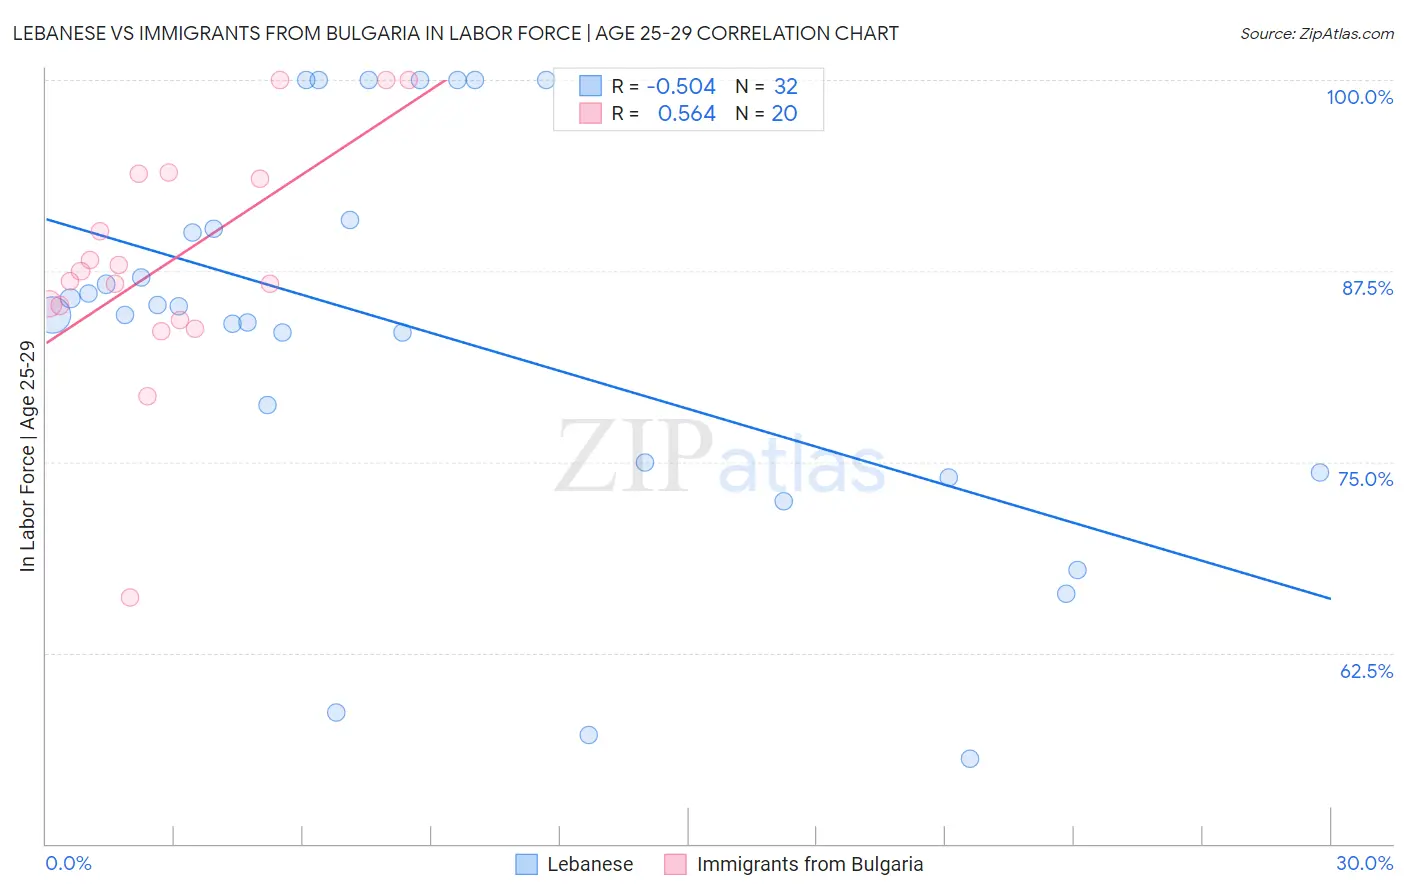
Lebanese vs Immigrants from Bulgaria In Labor Force | Age 25-29 Correlation Chart
The statistical analysis conducted on geographies consisting of 401,455,455 people shows a substantial negative correlation between the proportion of Lebanese and labor force participation rate among population between the ages 25 and 29 in the United States with a correlation coefficient (R) of -0.504 and weighted average of 84.3%. Similarly, the statistical analysis conducted on geographies consisting of 172,543,550 people shows a substantial positive correlation between the proportion of Immigrants from Bulgaria and labor force participation rate among population between the ages 25 and 29 in the United States with a correlation coefficient (R) of 0.564 and weighted average of 85.8%, a difference of 1.8%.
In Labor Force | Age 25-29 Correlation Summary
| Measurement | Lebanese | Immigrants from Bulgaria |
| Minimum | 55.6% | 66.1% |
| Maximum | 100.0% | 100.0% |
| Range | 44.4% | 33.9% |
| Mean | 83.5% | 88.1% |
| Median | 84.9% | 87.2% |
| Interquartile 25% (IQ1) | 74.7% | 84.8% |
| Interquartile 75% (IQ3) | 90.5% | 93.7% |
| Interquartile Range (IQR) | 15.9% | 8.9% |
| Standard Deviation (Sample) | 12.8% | 7.8% |
| Standard Deviation (Population) | 12.6% | 7.6% |
Similar Demographics by In Labor Force | Age 25-29
Demographics Similar to Lebanese by In Labor Force | Age 25-29
In terms of in labor force | age 25-29, the demographic groups most similar to Lebanese are Subsaharan African (84.3%, a difference of 0.010%), Japanese (84.3%, a difference of 0.010%), Immigrants from Syria (84.3%, a difference of 0.010%), Immigrants from Jordan (84.4%, a difference of 0.030%), and Chinese (84.3%, a difference of 0.030%).
| Demographics | Rating | Rank | In Labor Force | Age 25-29 |
| Immigrants | Armenia | 13.3 /100 | #207 | Poor 84.4% |
| Immigrants | Indonesia | 13.2 /100 | #208 | Poor 84.4% |
| Immigrants | Jordan | 12.8 /100 | #209 | Poor 84.4% |
| Chinese | 12.7 /100 | #210 | Poor 84.3% |
| Immigrants | Venezuela | 12.6 /100 | #211 | Poor 84.3% |
| Sub-Saharan Africans | 11.7 /100 | #212 | Poor 84.3% |
| Japanese | 11.4 /100 | #213 | Poor 84.3% |
| Lebanese | 11.1 /100 | #214 | Poor 84.3% |
| Immigrants | Syria | 10.7 /100 | #215 | Poor 84.3% |
| Israelis | 9.3 /100 | #216 | Tragic 84.3% |
| Immigrants | Ecuador | 9.3 /100 | #217 | Tragic 84.3% |
| Immigrants | Nigeria | 9.0 /100 | #218 | Tragic 84.3% |
| Immigrants | Saudi Arabia | 8.8 /100 | #219 | Tragic 84.3% |
| Nigerians | 7.2 /100 | #220 | Tragic 84.3% |
| Arabs | 6.8 /100 | #221 | Tragic 84.2% |
Demographics Similar to Immigrants from Bulgaria by In Labor Force | Age 25-29
In terms of in labor force | age 25-29, the demographic groups most similar to Immigrants from Bulgaria are German Russian (85.8%, a difference of 0.0%), Slovak (85.8%, a difference of 0.0%), Immigrants from Serbia (85.9%, a difference of 0.020%), Lithuanian (85.8%, a difference of 0.030%), and Cypriot (85.8%, a difference of 0.040%).
| Demographics | Rating | Rank | In Labor Force | Age 25-29 |
| Immigrants | North Macedonia | 100.0 /100 | #26 | Exceptional 85.9% |
| Paraguayans | 100.0 /100 | #27 | Exceptional 85.9% |
| Ugandans | 100.0 /100 | #28 | Exceptional 85.9% |
| Immigrants | Liberia | 100.0 /100 | #29 | Exceptional 85.9% |
| Immigrants | Serbia | 100.0 /100 | #30 | Exceptional 85.9% |
| German Russians | 100.0 /100 | #31 | Exceptional 85.8% |
| Slovaks | 100.0 /100 | #32 | Exceptional 85.8% |
| Immigrants | Bulgaria | 100.0 /100 | #33 | Exceptional 85.8% |
| Lithuanians | 99.9 /100 | #34 | Exceptional 85.8% |
| Cypriots | 99.9 /100 | #35 | Exceptional 85.8% |
| Immigrants | Nepal | 99.9 /100 | #36 | Exceptional 85.8% |
| Poles | 99.9 /100 | #37 | Exceptional 85.8% |
| Sierra Leoneans | 99.9 /100 | #38 | Exceptional 85.8% |
| Croatians | 99.9 /100 | #39 | Exceptional 85.8% |
| Immigrants | Albania | 99.9 /100 | #40 | Exceptional 85.7% |