Hmong vs Fijian Single Mother Poverty
COMPARE
Hmong
Fijian
Single Mother Poverty
Single Mother Poverty Comparison
Hmong
Fijians
31.2%
SINGLE MOTHER POVERTY
0.3/ 100
METRIC RATING
262nd/ 347
METRIC RANK
31.6%
SINGLE MOTHER POVERTY
0.1/ 100
METRIC RATING
273rd/ 347
METRIC RANK
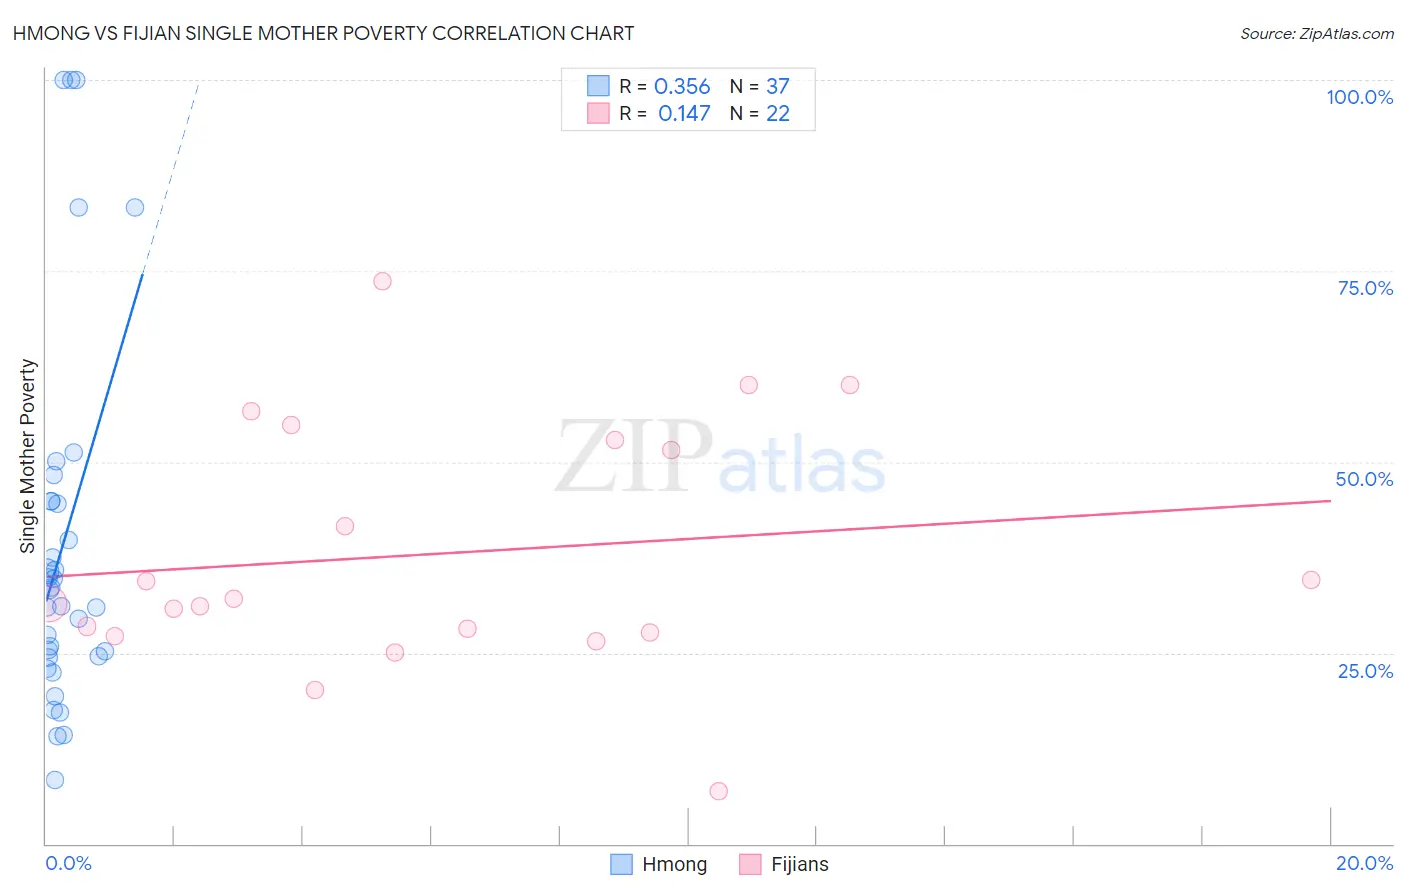
Hmong vs Fijian Single Mother Poverty Correlation Chart
The statistical analysis conducted on geographies consisting of 24,640,250 people shows a mild positive correlation between the proportion of Hmong and poverty level among single mothers in the United States with a correlation coefficient (R) of 0.356 and weighted average of 31.2%. Similarly, the statistical analysis conducted on geographies consisting of 55,870,068 people shows a poor positive correlation between the proportion of Fijians and poverty level among single mothers in the United States with a correlation coefficient (R) of 0.147 and weighted average of 31.6%, a difference of 1.3%.
Single Mother Poverty Correlation Summary
| Measurement | Hmong | Fijian |
| Minimum | 8.4% | 6.9% |
| Maximum | 100.0% | 73.6% |
| Range | 91.6% | 66.7% |
| Mean | 39.1% | 38.0% |
| Median | 33.2% | 31.8% |
| Interquartile 25% (IQ1) | 24.5% | 27.7% |
| Interquartile 75% (IQ3) | 44.8% | 52.9% |
| Interquartile Range (IQR) | 20.3% | 25.1% |
| Standard Deviation (Sample) | 24.2% | 16.2% |
| Standard Deviation (Population) | 23.9% | 15.8% |
Demographics Similar to Hmong and Fijians by Single Mother Poverty
In terms of single mother poverty, the demographic groups most similar to Hmong are Immigrants from El Salvador (31.2%, a difference of 0.14%), White/Caucasian (31.2%, a difference of 0.21%), Bahamian (31.3%, a difference of 0.27%), Immigrants from Ecuador (31.3%, a difference of 0.28%), and German Russian (31.3%, a difference of 0.31%). Similarly, the demographic groups most similar to Fijians are Immigrants from Micronesia (31.6%, a difference of 0.23%), Bangladeshi (31.7%, a difference of 0.23%), Immigrants from Cabo Verde (31.6%, a difference of 0.25%), Central American (31.8%, a difference of 0.42%), and British West Indian (31.5%, a difference of 0.49%).
| Demographics | Rating | Rank | Single Mother Poverty |
| Immigrants | Bahamas | 0.4 /100 | #257 | Tragic 31.1% |
| Immigrants | Caribbean | 0.4 /100 | #258 | Tragic 31.1% |
| Immigrants | Bangladesh | 0.4 /100 | #259 | Tragic 31.1% |
| Whites/Caucasians | 0.3 /100 | #260 | Tragic 31.2% |
| Immigrants | El Salvador | 0.3 /100 | #261 | Tragic 31.2% |
| Hmong | 0.3 /100 | #262 | Tragic 31.2% |
| Bahamians | 0.2 /100 | #263 | Tragic 31.3% |
| Immigrants | Ecuador | 0.2 /100 | #264 | Tragic 31.3% |
| German Russians | 0.2 /100 | #265 | Tragic 31.3% |
| Sub-Saharan Africans | 0.2 /100 | #266 | Tragic 31.4% |
| Immigrants | Belize | 0.2 /100 | #267 | Tragic 31.4% |
| Immigrants | Senegal | 0.1 /100 | #268 | Tragic 31.5% |
| Scotch-Irish | 0.1 /100 | #269 | Tragic 31.5% |
| British West Indians | 0.1 /100 | #270 | Tragic 31.5% |
| Immigrants | Cabo Verde | 0.1 /100 | #271 | Tragic 31.6% |
| Immigrants | Micronesia | 0.1 /100 | #272 | Tragic 31.6% |
| Fijians | 0.1 /100 | #273 | Tragic 31.6% |
| Bangladeshis | 0.1 /100 | #274 | Tragic 31.7% |
| Central Americans | 0.1 /100 | #275 | Tragic 31.8% |
| Delaware | 0.0 /100 | #276 | Tragic 31.8% |
| Mexican American Indians | 0.0 /100 | #277 | Tragic 31.9% |