Immigrants from Philippines vs Fijian Single Mother Poverty
COMPARE
Immigrants from Philippines
Fijian
Single Mother Poverty
Single Mother Poverty Comparison
Immigrants from Philippines
Fijians
26.5%
SINGLE MOTHER POVERTY
100.0/ 100
METRIC RATING
31st/ 347
METRIC RANK
31.6%
SINGLE MOTHER POVERTY
0.1/ 100
METRIC RATING
273rd/ 347
METRIC RANK
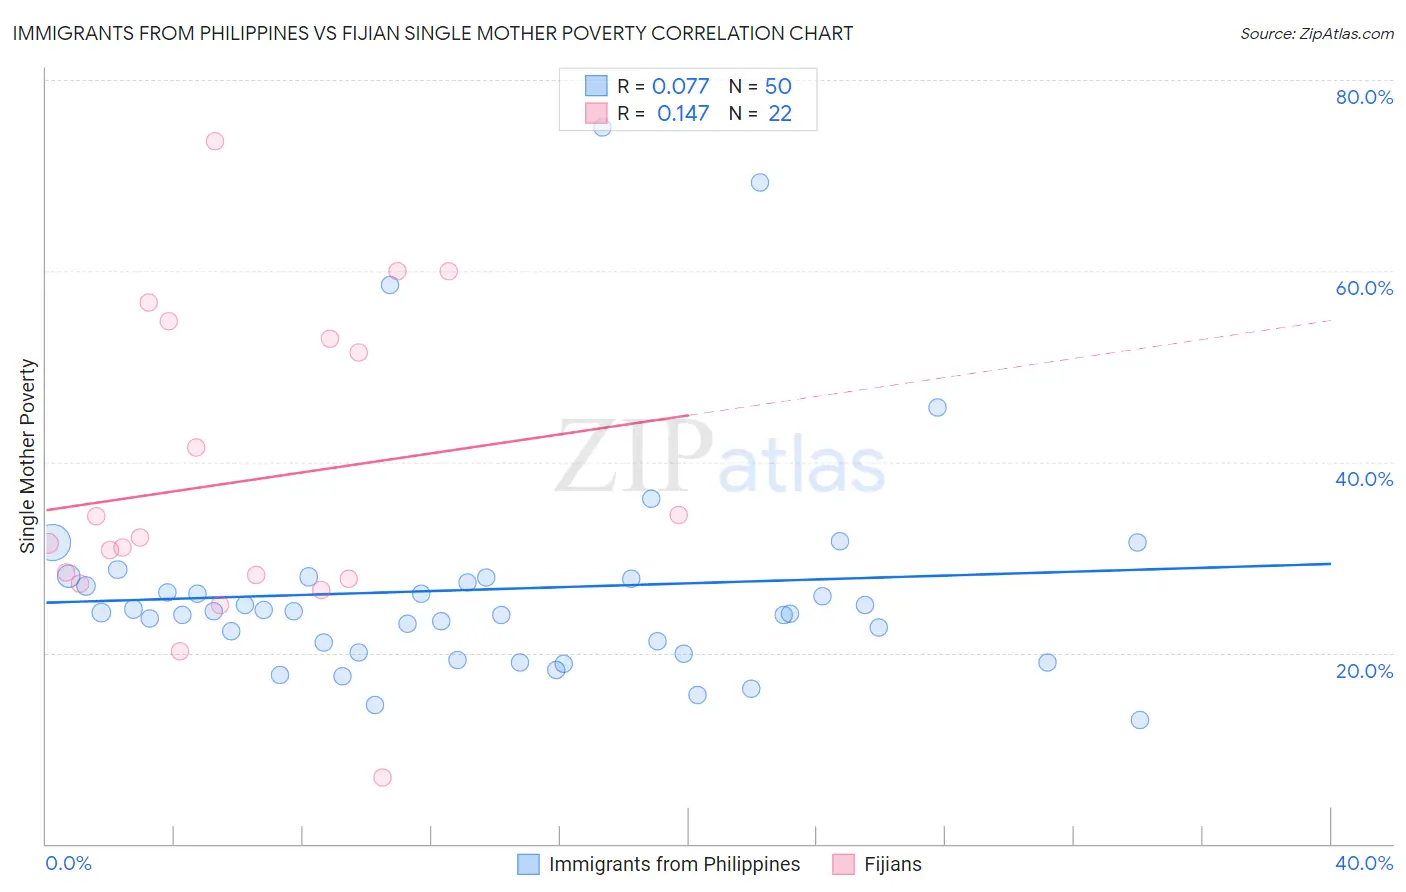
Immigrants from Philippines vs Fijian Single Mother Poverty Correlation Chart
The statistical analysis conducted on geographies consisting of 457,544,992 people shows a slight positive correlation between the proportion of Immigrants from Philippines and poverty level among single mothers in the United States with a correlation coefficient (R) of 0.077 and weighted average of 26.5%. Similarly, the statistical analysis conducted on geographies consisting of 55,870,068 people shows a poor positive correlation between the proportion of Fijians and poverty level among single mothers in the United States with a correlation coefficient (R) of 0.147 and weighted average of 31.6%, a difference of 19.5%.
Single Mother Poverty Correlation Summary
| Measurement | Immigrants from Philippines | Fijian |
| Minimum | 12.9% | 6.9% |
| Maximum | 75.0% | 73.6% |
| Range | 62.1% | 66.7% |
| Mean | 26.6% | 38.0% |
| Median | 24.3% | 31.8% |
| Interquartile 25% (IQ1) | 20.0% | 27.7% |
| Interquartile 75% (IQ3) | 27.7% | 52.9% |
| Interquartile Range (IQR) | 7.7% | 25.1% |
| Standard Deviation (Sample) | 12.0% | 16.2% |
| Standard Deviation (Population) | 11.8% | 15.8% |
Similar Demographics by Single Mother Poverty
Demographics Similar to Immigrants from Philippines by Single Mother Poverty
In terms of single mother poverty, the demographic groups most similar to Immigrants from Philippines are Turkish (26.4%, a difference of 0.16%), Jordanian (26.4%, a difference of 0.24%), Tongan (26.5%, a difference of 0.25%), Bulgarian (26.5%, a difference of 0.28%), and Immigrants from Indonesia (26.6%, a difference of 0.29%).
| Demographics | Rating | Rank | Single Mother Poverty |
| Immigrants | Moldova | 100.0 /100 | #24 | Exceptional 26.2% |
| Immigrants | Asia | 100.0 /100 | #25 | Exceptional 26.3% |
| Immigrants | Sri Lanka | 100.0 /100 | #26 | Exceptional 26.3% |
| Immigrants | Japan | 100.0 /100 | #27 | Exceptional 26.4% |
| Koreans | 100.0 /100 | #28 | Exceptional 26.4% |
| Jordanians | 100.0 /100 | #29 | Exceptional 26.4% |
| Turks | 100.0 /100 | #30 | Exceptional 26.4% |
| Immigrants | Philippines | 100.0 /100 | #31 | Exceptional 26.5% |
| Tongans | 99.9 /100 | #32 | Exceptional 26.5% |
| Bulgarians | 99.9 /100 | #33 | Exceptional 26.5% |
| Immigrants | Indonesia | 99.9 /100 | #34 | Exceptional 26.6% |
| Maltese | 99.9 /100 | #35 | Exceptional 26.6% |
| Okinawans | 99.9 /100 | #36 | Exceptional 26.6% |
| Immigrants | Israel | 99.9 /100 | #37 | Exceptional 26.6% |
| Immigrants | Fiji | 99.9 /100 | #38 | Exceptional 26.6% |
Demographics Similar to Fijians by Single Mother Poverty
In terms of single mother poverty, the demographic groups most similar to Fijians are Immigrants from Micronesia (31.6%, a difference of 0.23%), Bangladeshi (31.7%, a difference of 0.23%), Immigrants from Cabo Verde (31.6%, a difference of 0.25%), Central American (31.8%, a difference of 0.42%), and British West Indian (31.5%, a difference of 0.49%).
| Demographics | Rating | Rank | Single Mother Poverty |
| Sub-Saharan Africans | 0.2 /100 | #266 | Tragic 31.4% |
| Immigrants | Belize | 0.2 /100 | #267 | Tragic 31.4% |
| Immigrants | Senegal | 0.1 /100 | #268 | Tragic 31.5% |
| Scotch-Irish | 0.1 /100 | #269 | Tragic 31.5% |
| British West Indians | 0.1 /100 | #270 | Tragic 31.5% |
| Immigrants | Cabo Verde | 0.1 /100 | #271 | Tragic 31.6% |
| Immigrants | Micronesia | 0.1 /100 | #272 | Tragic 31.6% |
| Fijians | 0.1 /100 | #273 | Tragic 31.6% |
| Bangladeshis | 0.1 /100 | #274 | Tragic 31.7% |
| Central Americans | 0.1 /100 | #275 | Tragic 31.8% |
| Delaware | 0.0 /100 | #276 | Tragic 31.8% |
| Mexican American Indians | 0.0 /100 | #277 | Tragic 31.9% |
| Immigrants | Zaire | 0.0 /100 | #278 | Tragic 32.0% |
| Marshallese | 0.0 /100 | #279 | Tragic 32.1% |
| Immigrants | Nonimmigrants | 0.0 /100 | #280 | Tragic 32.2% |