Korean vs German Russian Poverty
COMPARE
Korean
German Russian
Poverty
Poverty Comparison
Koreans
German Russians
10.9%
POVERTY
99.2/ 100
METRIC RATING
42nd/ 347
METRIC RANK
13.4%
POVERTY
2.2/ 100
METRIC RATING
225th/ 347
METRIC RANK
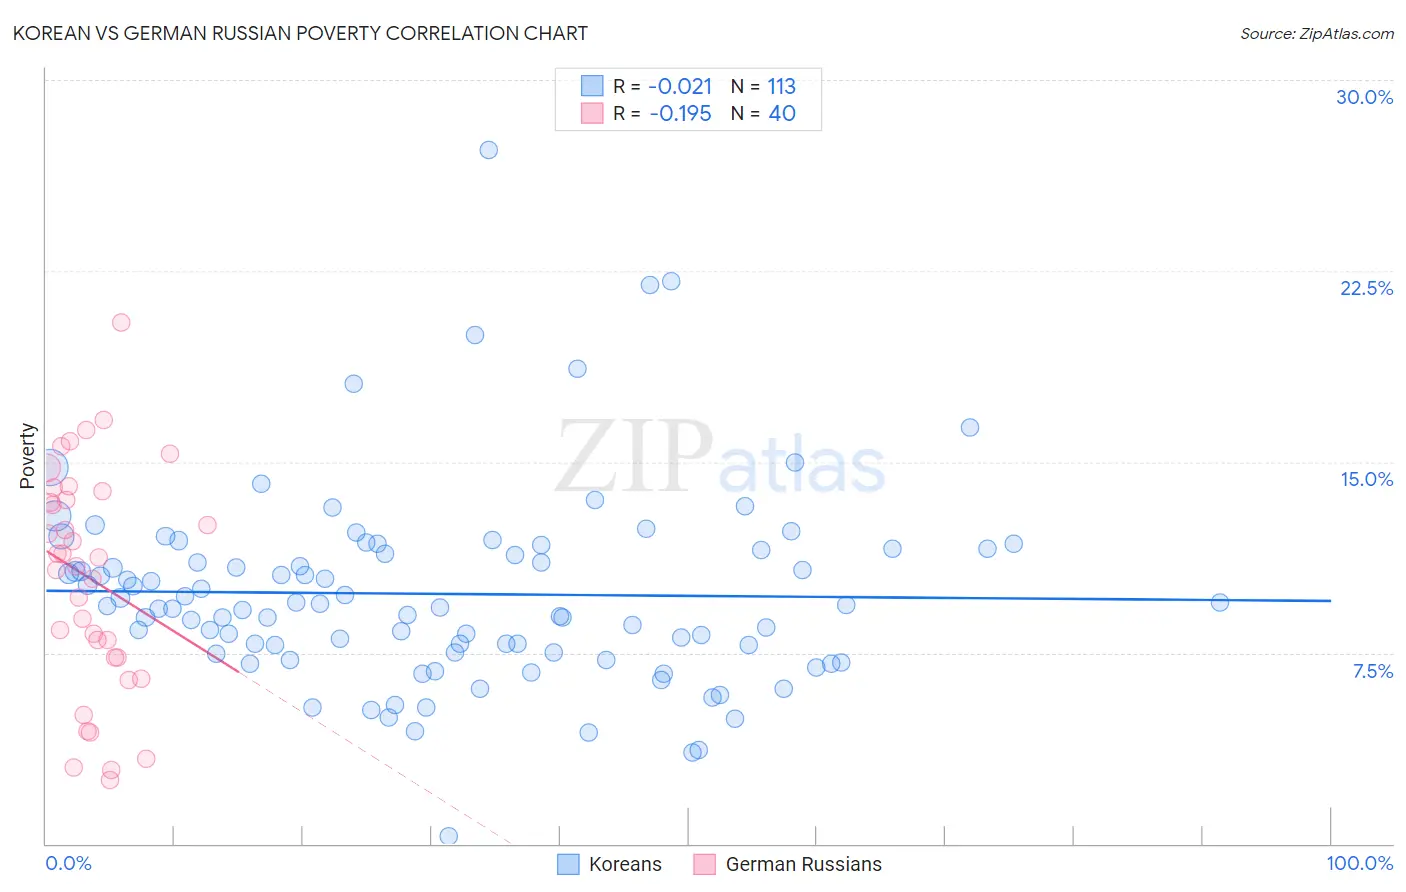
Korean vs German Russian Poverty Correlation Chart
The statistical analysis conducted on geographies consisting of 510,388,718 people shows no correlation between the proportion of Koreans and poverty level in the United States with a correlation coefficient (R) of -0.021 and weighted average of 10.9%. Similarly, the statistical analysis conducted on geographies consisting of 96,450,415 people shows a poor negative correlation between the proportion of German Russians and poverty level in the United States with a correlation coefficient (R) of -0.195 and weighted average of 13.4%, a difference of 23.5%.
Poverty Correlation Summary
| Measurement | Korean | German Russian |
| Minimum | 0.27% | 2.5% |
| Maximum | 27.2% | 20.5% |
| Range | 27.0% | 18.0% |
| Mean | 9.8% | 10.4% |
| Median | 9.3% | 11.1% |
| Interquartile 25% (IQ1) | 7.5% | 7.3% |
| Interquartile 75% (IQ3) | 11.6% | 13.7% |
| Interquartile Range (IQR) | 4.0% | 6.4% |
| Standard Deviation (Sample) | 3.9% | 4.4% |
| Standard Deviation (Population) | 3.8% | 4.3% |
Similar Demographics by Poverty
Demographics Similar to Koreans by Poverty
In terms of poverty, the demographic groups most similar to Koreans are Immigrants from Singapore (10.9%, a difference of 0.050%), Immigrants from Moldova (10.9%, a difference of 0.19%), Immigrants from Iran (10.9%, a difference of 0.22%), Russian (10.9%, a difference of 0.31%), and Immigrants from Pakistan (10.8%, a difference of 0.36%).
| Demographics | Rating | Rank | Poverty |
| Tongans | 99.4 /100 | #35 | Exceptional 10.8% |
| Cypriots | 99.3 /100 | #36 | Exceptional 10.8% |
| Immigrants | Greece | 99.3 /100 | #37 | Exceptional 10.8% |
| Czechs | 99.3 /100 | #38 | Exceptional 10.8% |
| Immigrants | Pakistan | 99.3 /100 | #39 | Exceptional 10.8% |
| Russians | 99.3 /100 | #40 | Exceptional 10.9% |
| Immigrants | Iran | 99.2 /100 | #41 | Exceptional 10.9% |
| Koreans | 99.2 /100 | #42 | Exceptional 10.9% |
| Immigrants | Singapore | 99.2 /100 | #43 | Exceptional 10.9% |
| Immigrants | Moldova | 99.1 /100 | #44 | Exceptional 10.9% |
| Turks | 98.9 /100 | #45 | Exceptional 11.0% |
| Immigrants | Czechoslovakia | 98.9 /100 | #46 | Exceptional 11.0% |
| Immigrants | Romania | 98.9 /100 | #47 | Exceptional 11.0% |
| Slovenes | 98.9 /100 | #48 | Exceptional 11.0% |
| Immigrants | Japan | 98.9 /100 | #49 | Exceptional 11.0% |
Demographics Similar to German Russians by Poverty
In terms of poverty, the demographic groups most similar to German Russians are Marshallese (13.4%, a difference of 0.010%), Alaska Native (13.5%, a difference of 0.16%), Immigrants from Eritrea (13.4%, a difference of 0.22%), Immigrants from Africa (13.4%, a difference of 0.31%), and Immigrants from Micronesia (13.4%, a difference of 0.35%).
| Demographics | Rating | Rank | Poverty |
| Immigrants | Thailand | 3.1 /100 | #218 | Tragic 13.3% |
| Immigrants | Cambodia | 3.0 /100 | #219 | Tragic 13.4% |
| Americans | 2.9 /100 | #220 | Tragic 13.4% |
| Alsatians | 2.6 /100 | #221 | Tragic 13.4% |
| Immigrants | Micronesia | 2.6 /100 | #222 | Tragic 13.4% |
| Immigrants | Africa | 2.5 /100 | #223 | Tragic 13.4% |
| Immigrants | Eritrea | 2.4 /100 | #224 | Tragic 13.4% |
| German Russians | 2.2 /100 | #225 | Tragic 13.4% |
| Marshallese | 2.2 /100 | #226 | Tragic 13.4% |
| Alaska Natives | 2.1 /100 | #227 | Tragic 13.5% |
| Immigrants | Nigeria | 1.7 /100 | #228 | Tragic 13.5% |
| Osage | 1.5 /100 | #229 | Tragic 13.6% |
| Alaskan Athabascans | 1.5 /100 | #230 | Tragic 13.6% |
| Nigerians | 1.4 /100 | #231 | Tragic 13.6% |
| Fijians | 0.8 /100 | #232 | Tragic 13.7% |