Korean vs Syrian Poverty
COMPARE
Korean
Syrian
Poverty
Poverty Comparison
Koreans
Syrians
10.9%
POVERTY
99.2/ 100
METRIC RATING
42nd/ 347
METRIC RANK
12.0%
POVERTY
75.1/ 100
METRIC RATING
145th/ 347
METRIC RANK
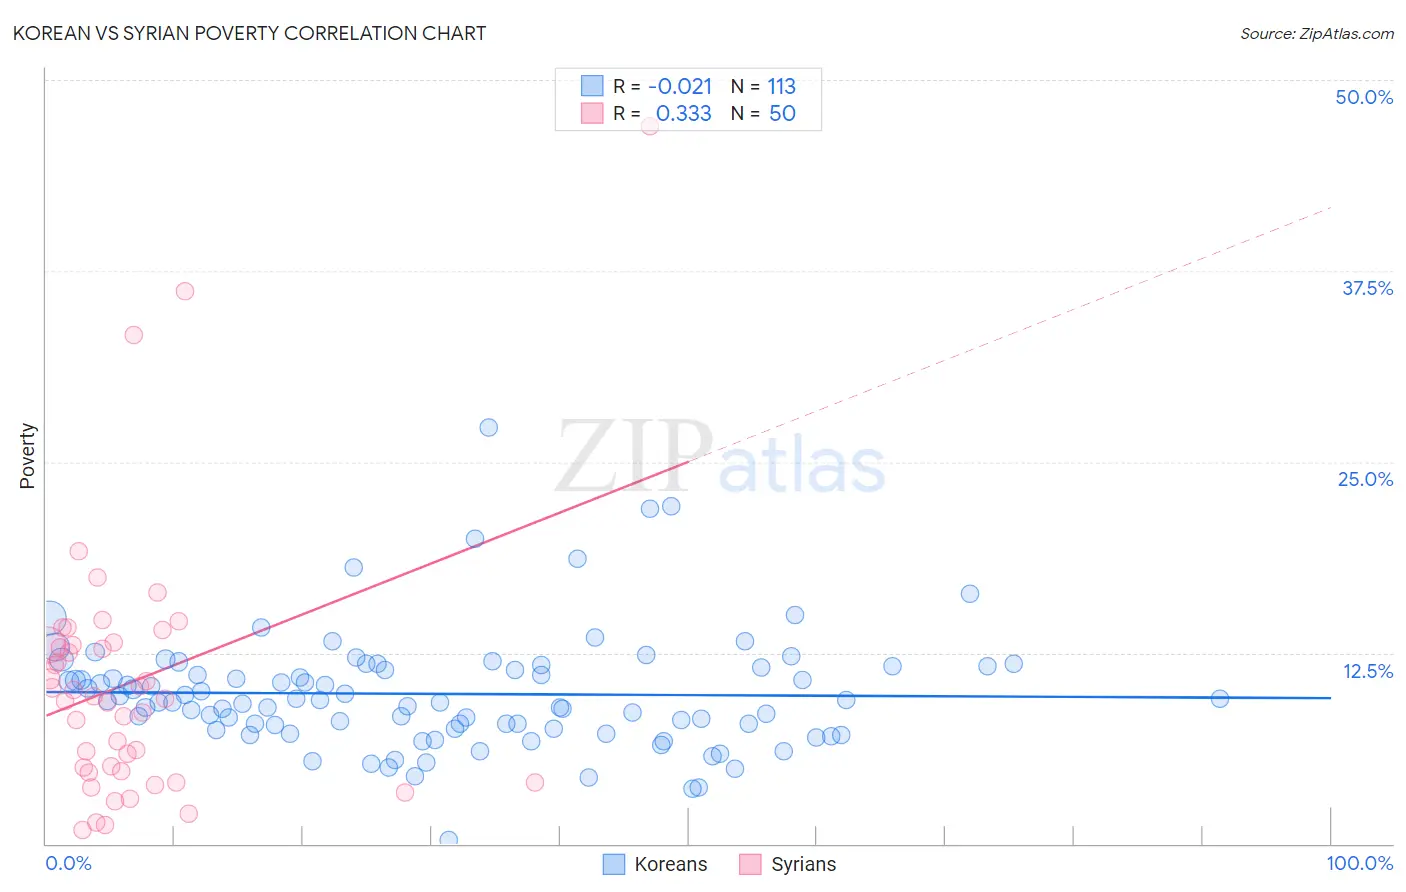
Korean vs Syrian Poverty Correlation Chart
The statistical analysis conducted on geographies consisting of 510,388,718 people shows no correlation between the proportion of Koreans and poverty level in the United States with a correlation coefficient (R) of -0.021 and weighted average of 10.9%. Similarly, the statistical analysis conducted on geographies consisting of 266,206,750 people shows a mild positive correlation between the proportion of Syrians and poverty level in the United States with a correlation coefficient (R) of 0.333 and weighted average of 12.0%, a difference of 10.1%.
Poverty Correlation Summary
| Measurement | Korean | Syrian |
| Minimum | 0.27% | 0.89% |
| Maximum | 27.2% | 47.0% |
| Range | 27.0% | 46.1% |
| Mean | 9.8% | 10.6% |
| Median | 9.3% | 9.6% |
| Interquartile 25% (IQ1) | 7.5% | 4.8% |
| Interquartile 75% (IQ3) | 11.6% | 13.0% |
| Interquartile Range (IQR) | 4.0% | 8.3% |
| Standard Deviation (Sample) | 3.9% | 8.7% |
| Standard Deviation (Population) | 3.8% | 8.6% |
Similar Demographics by Poverty
Demographics Similar to Koreans by Poverty
In terms of poverty, the demographic groups most similar to Koreans are Immigrants from Singapore (10.9%, a difference of 0.050%), Immigrants from Moldova (10.9%, a difference of 0.19%), Immigrants from Iran (10.9%, a difference of 0.22%), Russian (10.9%, a difference of 0.31%), and Immigrants from Pakistan (10.8%, a difference of 0.36%).
| Demographics | Rating | Rank | Poverty |
| Tongans | 99.4 /100 | #35 | Exceptional 10.8% |
| Cypriots | 99.3 /100 | #36 | Exceptional 10.8% |
| Immigrants | Greece | 99.3 /100 | #37 | Exceptional 10.8% |
| Czechs | 99.3 /100 | #38 | Exceptional 10.8% |
| Immigrants | Pakistan | 99.3 /100 | #39 | Exceptional 10.8% |
| Russians | 99.3 /100 | #40 | Exceptional 10.9% |
| Immigrants | Iran | 99.2 /100 | #41 | Exceptional 10.9% |
| Koreans | 99.2 /100 | #42 | Exceptional 10.9% |
| Immigrants | Singapore | 99.2 /100 | #43 | Exceptional 10.9% |
| Immigrants | Moldova | 99.1 /100 | #44 | Exceptional 10.9% |
| Turks | 98.9 /100 | #45 | Exceptional 11.0% |
| Immigrants | Czechoslovakia | 98.9 /100 | #46 | Exceptional 11.0% |
| Immigrants | Romania | 98.9 /100 | #47 | Exceptional 11.0% |
| Slovenes | 98.9 /100 | #48 | Exceptional 11.0% |
| Immigrants | Japan | 98.9 /100 | #49 | Exceptional 11.0% |
Demographics Similar to Syrians by Poverty
In terms of poverty, the demographic groups most similar to Syrians are Afghan (12.0%, a difference of 0.030%), Immigrants from Bosnia and Herzegovina (12.0%, a difference of 0.19%), Immigrants from Germany (12.0%, a difference of 0.31%), Immigrants from Malaysia (12.0%, a difference of 0.32%), and Immigrants from Kazakhstan (12.0%, a difference of 0.37%).
| Demographics | Rating | Rank | Poverty |
| Immigrants | Jordan | 82.4 /100 | #138 | Excellent 11.9% |
| Pakistanis | 82.2 /100 | #139 | Excellent 11.9% |
| Immigrants | Peru | 81.1 /100 | #140 | Excellent 11.9% |
| Immigrants | France | 80.5 /100 | #141 | Excellent 11.9% |
| Basques | 80.4 /100 | #142 | Excellent 11.9% |
| Brazilians | 79.7 /100 | #143 | Good 11.9% |
| Icelanders | 77.9 /100 | #144 | Good 11.9% |
| Syrians | 75.1 /100 | #145 | Good 12.0% |
| Afghans | 74.9 /100 | #146 | Good 12.0% |
| Immigrants | Bosnia and Herzegovina | 73.7 /100 | #147 | Good 12.0% |
| Immigrants | Germany | 72.7 /100 | #148 | Good 12.0% |
| Immigrants | Malaysia | 72.7 /100 | #149 | Good 12.0% |
| Immigrants | Kazakhstan | 72.3 /100 | #150 | Good 12.0% |
| Samoans | 71.9 /100 | #151 | Good 12.0% |
| Armenians | 67.6 /100 | #152 | Good 12.1% |