Korean vs Taiwanese Receiving Food Stamps
COMPARE
Korean
Taiwanese
Receiving Food Stamps
Receiving Food Stamps Comparison
Koreans
Taiwanese
10.4%
RECEIVING FOOD STAMPS
96.3/ 100
METRIC RATING
107th/ 347
METRIC RANK
11.0%
RECEIVING FOOD STAMPS
84.2/ 100
METRIC RATING
146th/ 347
METRIC RANK
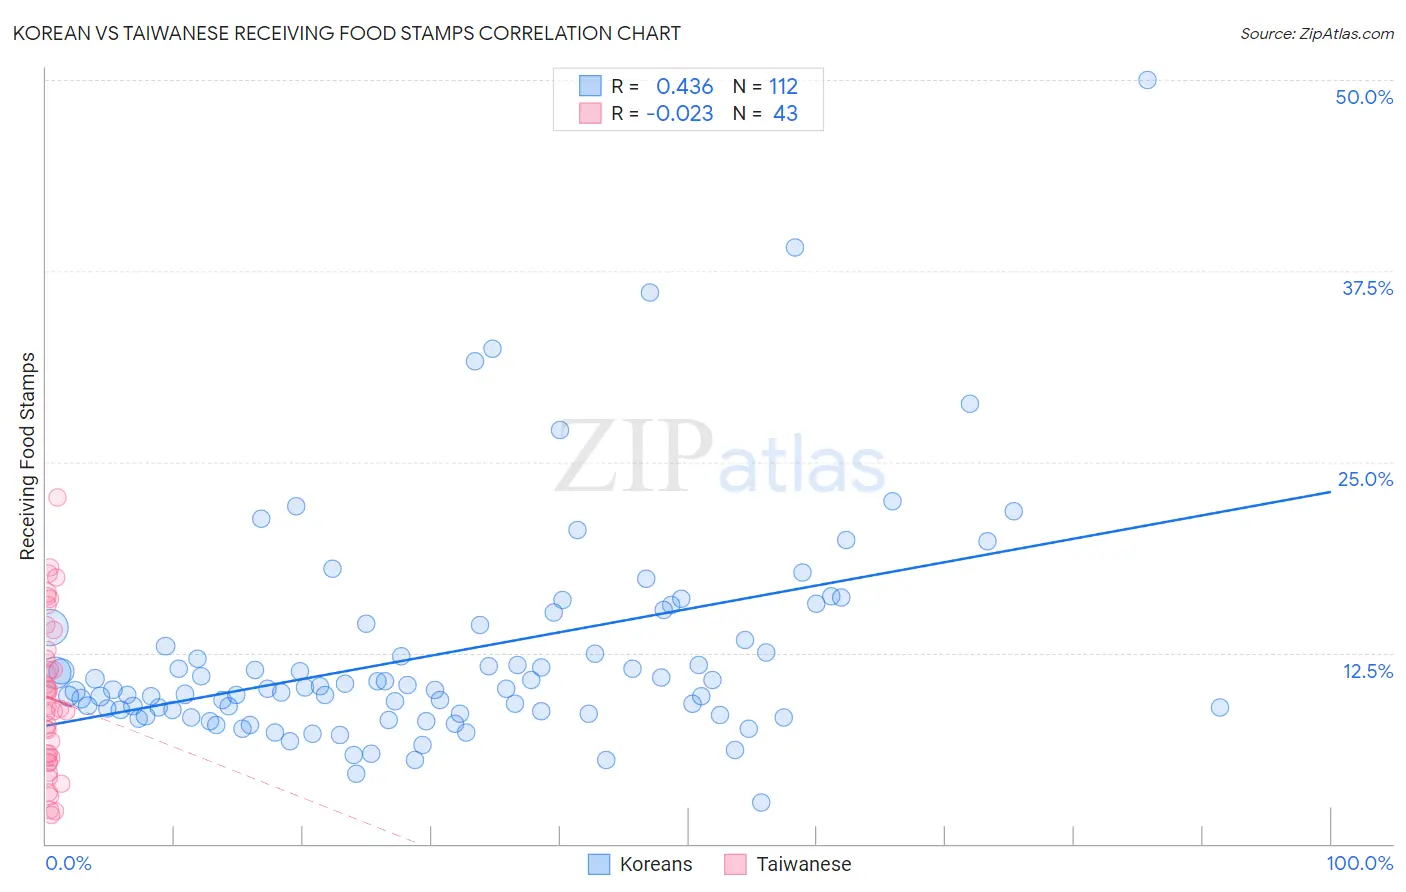
Korean vs Taiwanese Receiving Food Stamps Correlation Chart
The statistical analysis conducted on geographies consisting of 508,812,505 people shows a moderate positive correlation between the proportion of Koreans and percentage of population receiving government assistance and/or food stamps in the United States with a correlation coefficient (R) of 0.436 and weighted average of 10.4%. Similarly, the statistical analysis conducted on geographies consisting of 31,675,875 people shows no correlation between the proportion of Taiwanese and percentage of population receiving government assistance and/or food stamps in the United States with a correlation coefficient (R) of -0.023 and weighted average of 11.0%, a difference of 6.2%.
Receiving Food Stamps Correlation Summary
| Measurement | Korean | Taiwanese |
| Minimum | 2.7% | 1.9% |
| Maximum | 50.0% | 22.7% |
| Range | 47.3% | 20.8% |
| Mean | 12.5% | 9.5% |
| Median | 10.1% | 8.8% |
| Interquartile 25% (IQ1) | 8.6% | 5.6% |
| Interquartile 75% (IQ3) | 13.7% | 12.7% |
| Interquartile Range (IQR) | 5.1% | 7.1% |
| Standard Deviation (Sample) | 7.2% | 5.0% |
| Standard Deviation (Population) | 7.2% | 5.0% |
Similar Demographics by Receiving Food Stamps
Demographics Similar to Koreans by Receiving Food Stamps
In terms of receiving food stamps, the demographic groups most similar to Koreans are Carpatho Rusyn (10.4%, a difference of 0.030%), Immigrants from Pakistan (10.4%, a difference of 0.080%), Immigrants from Italy (10.4%, a difference of 0.15%), Immigrants from Malaysia (10.4%, a difference of 0.24%), and Pakistani (10.4%, a difference of 0.36%).
| Demographics | Rating | Rank | Receiving Food Stamps |
| Immigrants | Western Europe | 96.9 /100 | #100 | Exceptional 10.3% |
| Palestinians | 96.9 /100 | #101 | Exceptional 10.3% |
| Immigrants | Europe | 96.8 /100 | #102 | Exceptional 10.3% |
| Immigrants | Latvia | 96.8 /100 | #103 | Exceptional 10.3% |
| Immigrants | Hungary | 96.7 /100 | #104 | Exceptional 10.3% |
| Immigrants | Malaysia | 96.5 /100 | #105 | Exceptional 10.4% |
| Immigrants | Italy | 96.4 /100 | #106 | Exceptional 10.4% |
| Koreans | 96.3 /100 | #107 | Exceptional 10.4% |
| Carpatho Rusyns | 96.2 /100 | #108 | Exceptional 10.4% |
| Immigrants | Pakistan | 96.2 /100 | #109 | Exceptional 10.4% |
| Pakistanis | 95.9 /100 | #110 | Exceptional 10.4% |
| Romanians | 95.8 /100 | #111 | Exceptional 10.4% |
| Mongolians | 95.8 /100 | #112 | Exceptional 10.5% |
| Icelanders | 95.4 /100 | #113 | Exceptional 10.5% |
| Scotch-Irish | 95.1 /100 | #114 | Exceptional 10.5% |
Demographics Similar to Taiwanese by Receiving Food Stamps
In terms of receiving food stamps, the demographic groups most similar to Taiwanese are White/Caucasian (11.1%, a difference of 0.090%), Hungarian (11.0%, a difference of 0.24%), Immigrants from South Eastern Asia (11.1%, a difference of 0.26%), Brazilian (11.1%, a difference of 0.28%), and Soviet Union (11.1%, a difference of 0.30%).
| Demographics | Rating | Rank | Receiving Food Stamps |
| Hmong | 88.4 /100 | #139 | Excellent 10.9% |
| Celtics | 87.8 /100 | #140 | Excellent 10.9% |
| Immigrants | Vietnam | 86.7 /100 | #141 | Excellent 11.0% |
| Chileans | 86.2 /100 | #142 | Excellent 11.0% |
| Immigrants | Northern Africa | 86.0 /100 | #143 | Excellent 11.0% |
| Syrians | 85.5 /100 | #144 | Excellent 11.0% |
| Hungarians | 85.1 /100 | #145 | Excellent 11.0% |
| Taiwanese | 84.2 /100 | #146 | Excellent 11.0% |
| Whites/Caucasians | 83.9 /100 | #147 | Excellent 11.1% |
| Immigrants | South Eastern Asia | 83.3 /100 | #148 | Excellent 11.1% |
| Brazilians | 83.2 /100 | #149 | Excellent 11.1% |
| Soviet Union | 83.1 /100 | #150 | Excellent 11.1% |
| Immigrants | Spain | 81.7 /100 | #151 | Excellent 11.1% |
| Immigrants | Kazakhstan | 81.7 /100 | #152 | Excellent 11.1% |
| Lebanese | 81.6 /100 | #153 | Excellent 11.1% |