Korean vs Cajun Single Mother Poverty
COMPARE
Korean
Cajun
Single Mother Poverty
Single Mother Poverty Comparison
Koreans
Cajuns
26.4%
SINGLE MOTHER POVERTY
100.0/ 100
METRIC RATING
28th/ 347
METRIC RANK
40.3%
SINGLE MOTHER POVERTY
0.0/ 100
METRIC RATING
343rd/ 347
METRIC RANK
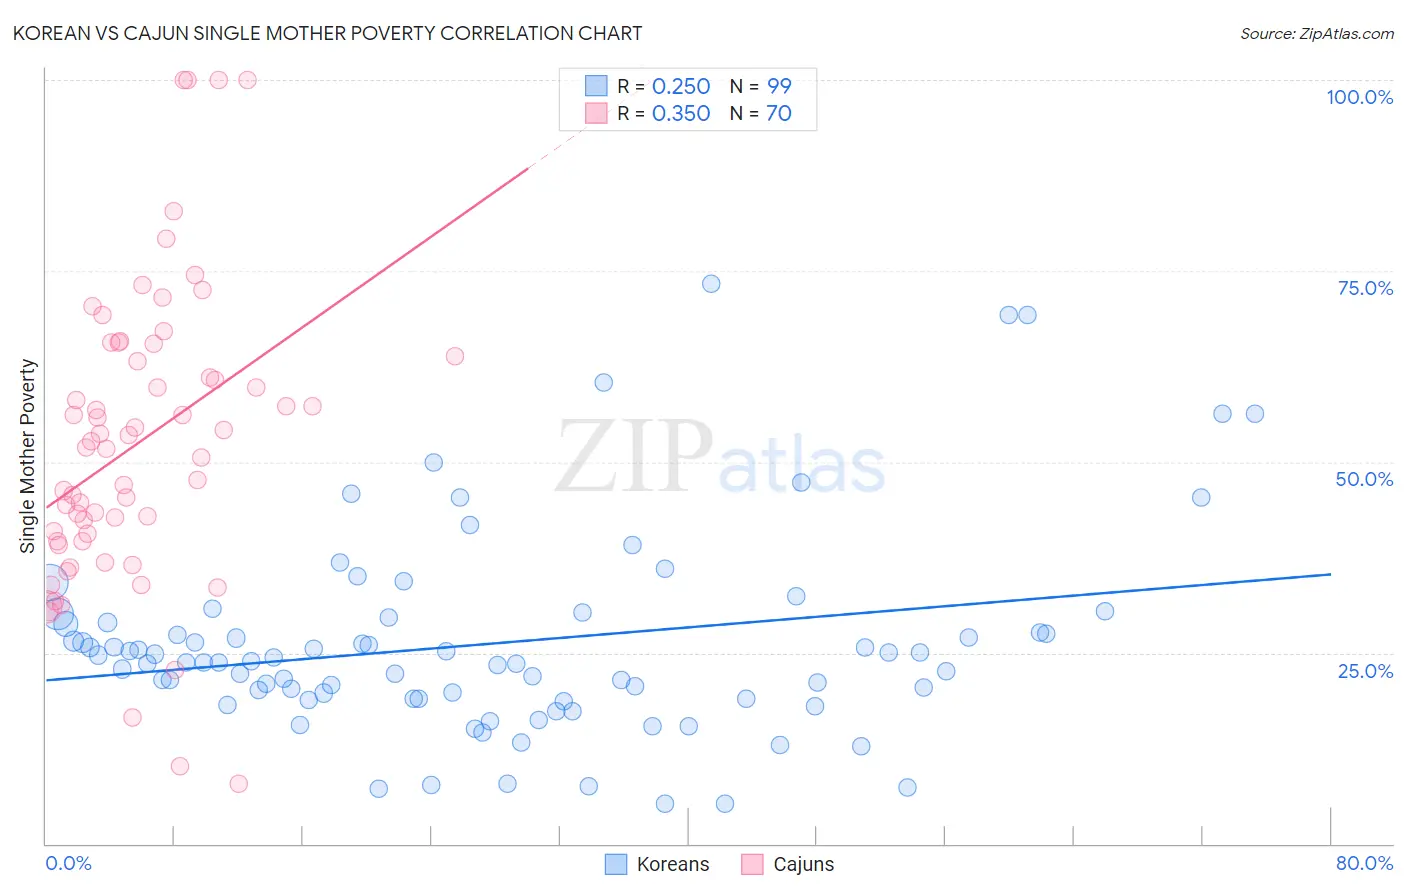
Korean vs Cajun Single Mother Poverty Correlation Chart
The statistical analysis conducted on geographies consisting of 493,220,076 people shows a weak positive correlation between the proportion of Koreans and poverty level among single mothers in the United States with a correlation coefficient (R) of 0.250 and weighted average of 26.4%. Similarly, the statistical analysis conducted on geographies consisting of 148,029,233 people shows a mild positive correlation between the proportion of Cajuns and poverty level among single mothers in the United States with a correlation coefficient (R) of 0.350 and weighted average of 40.3%, a difference of 52.8%.
Single Mother Poverty Correlation Summary
| Measurement | Korean | Cajun |
| Minimum | 5.2% | 7.8% |
| Maximum | 73.4% | 100.0% |
| Range | 68.2% | 92.2% |
| Mean | 26.2% | 52.5% |
| Median | 23.8% | 52.2% |
| Interquartile 25% (IQ1) | 19.0% | 39.6% |
| Interquartile 75% (IQ3) | 29.0% | 63.8% |
| Interquartile Range (IQR) | 10.0% | 24.2% |
| Standard Deviation (Sample) | 13.2% | 19.4% |
| Standard Deviation (Population) | 13.1% | 19.3% |
Similar Demographics by Single Mother Poverty
Demographics Similar to Koreans by Single Mother Poverty
In terms of single mother poverty, the demographic groups most similar to Koreans are Immigrants from Japan (26.4%, a difference of 0.010%), Jordanian (26.4%, a difference of 0.050%), Turkish (26.4%, a difference of 0.14%), Immigrants from Sri Lanka (26.3%, a difference of 0.24%), and Immigrants from Philippines (26.5%, a difference of 0.30%).
| Demographics | Rating | Rank | Single Mother Poverty |
| Immigrants | Bolivia | 100.0 /100 | #21 | Exceptional 26.2% |
| Immigrants | Korea | 100.0 /100 | #22 | Exceptional 26.2% |
| Burmese | 100.0 /100 | #23 | Exceptional 26.2% |
| Immigrants | Moldova | 100.0 /100 | #24 | Exceptional 26.2% |
| Immigrants | Asia | 100.0 /100 | #25 | Exceptional 26.3% |
| Immigrants | Sri Lanka | 100.0 /100 | #26 | Exceptional 26.3% |
| Immigrants | Japan | 100.0 /100 | #27 | Exceptional 26.4% |
| Koreans | 100.0 /100 | #28 | Exceptional 26.4% |
| Jordanians | 100.0 /100 | #29 | Exceptional 26.4% |
| Turks | 100.0 /100 | #30 | Exceptional 26.4% |
| Immigrants | Philippines | 100.0 /100 | #31 | Exceptional 26.5% |
| Tongans | 99.9 /100 | #32 | Exceptional 26.5% |
| Bulgarians | 99.9 /100 | #33 | Exceptional 26.5% |
| Immigrants | Indonesia | 99.9 /100 | #34 | Exceptional 26.6% |
| Maltese | 99.9 /100 | #35 | Exceptional 26.6% |
Demographics Similar to Cajuns by Single Mother Poverty
In terms of single mother poverty, the demographic groups most similar to Cajuns are Navajo (40.2%, a difference of 0.33%), Colville (39.3%, a difference of 2.7%), Sioux (38.8%, a difference of 4.0%), Crow (38.6%, a difference of 4.4%), and Pima (38.6%, a difference of 4.5%).
| Demographics | Rating | Rank | Single Mother Poverty |
| Menominee | 0.0 /100 | #333 | Tragic 37.1% |
| Pueblo | 0.0 /100 | #334 | Tragic 37.2% |
| Yuman | 0.0 /100 | #335 | Tragic 37.8% |
| Cheyenne | 0.0 /100 | #336 | Tragic 38.5% |
| Immigrants | Yemen | 0.0 /100 | #337 | Tragic 38.5% |
| Pima | 0.0 /100 | #338 | Tragic 38.6% |
| Crow | 0.0 /100 | #339 | Tragic 38.6% |
| Sioux | 0.0 /100 | #340 | Tragic 38.8% |
| Colville | 0.0 /100 | #341 | Tragic 39.3% |
| Navajo | 0.0 /100 | #342 | Tragic 40.2% |
| Cajuns | 0.0 /100 | #343 | Tragic 40.3% |
| Tohono O'odham | 0.0 /100 | #344 | Tragic 43.0% |
| Lumbee | 0.0 /100 | #345 | Tragic 43.2% |
| Houma | 0.0 /100 | #346 | Tragic 43.5% |
| Puerto Ricans | 0.0 /100 | #347 | Tragic 44.5% |