Kiowa vs Immigrants from Bangladesh Single Male Poverty
COMPARE
Kiowa
Immigrants from Bangladesh
Single Male Poverty
Single Male Poverty Comparison
Kiowa
Immigrants from Bangladesh
18.3%
SINGLE MALE POVERTY
0.0/ 100
METRIC RATING
328th/ 347
METRIC RANK
13.0%
SINGLE MALE POVERTY
20.4/ 100
METRIC RATING
203rd/ 347
METRIC RANK
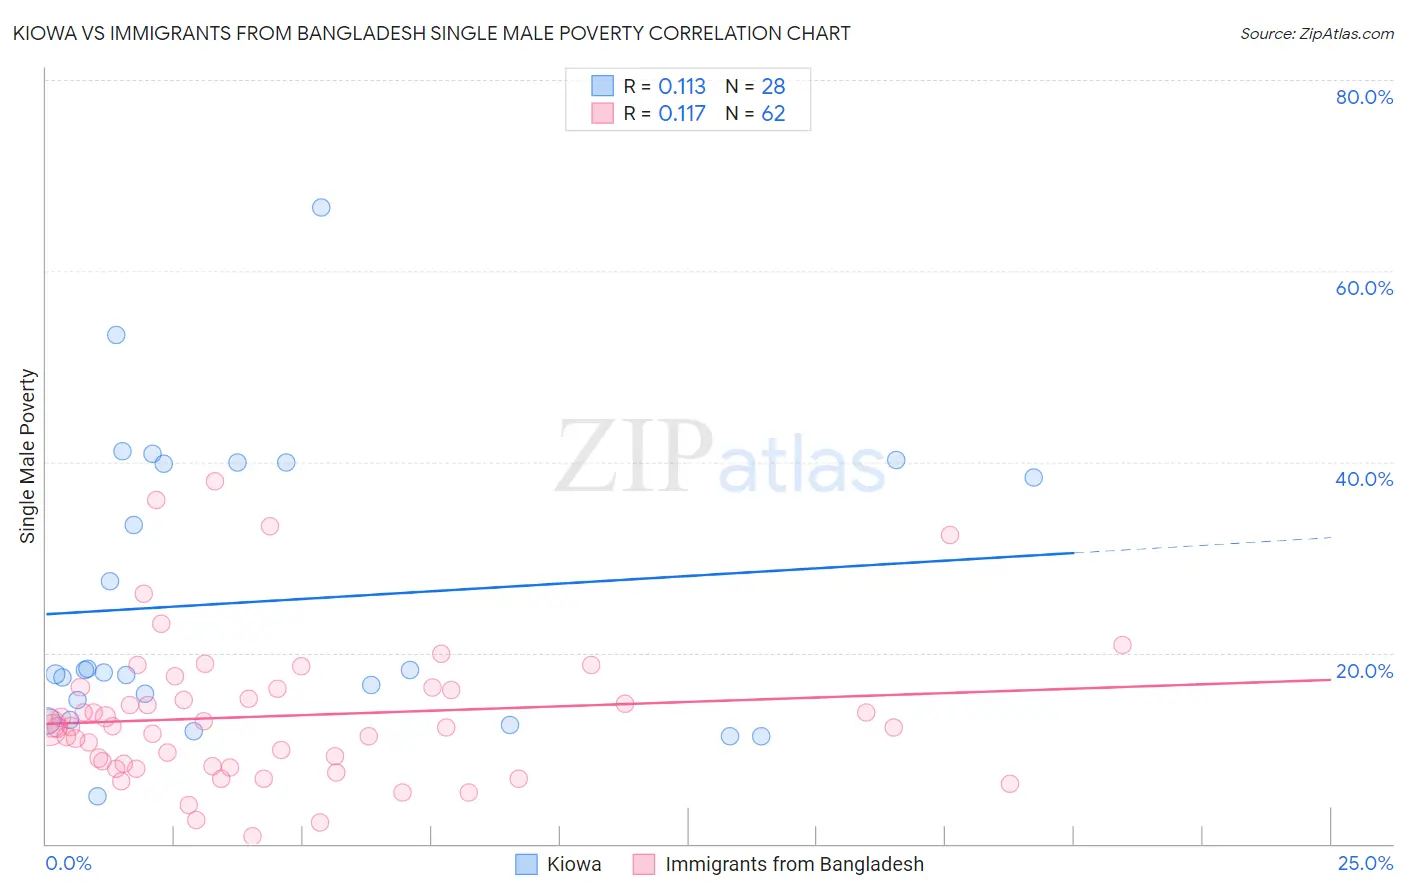
Kiowa vs Immigrants from Bangladesh Single Male Poverty Correlation Chart
The statistical analysis conducted on geographies consisting of 54,682,389 people shows a poor positive correlation between the proportion of Kiowa and poverty level among single males in the United States with a correlation coefficient (R) of 0.113 and weighted average of 18.3%. Similarly, the statistical analysis conducted on geographies consisting of 188,106,826 people shows a poor positive correlation between the proportion of Immigrants from Bangladesh and poverty level among single males in the United States with a correlation coefficient (R) of 0.117 and weighted average of 13.0%, a difference of 40.5%.
Single Male Poverty Correlation Summary
| Measurement | Kiowa | Immigrants from Bangladesh |
| Minimum | 5.0% | 0.77% |
| Maximum | 66.7% | 38.0% |
| Range | 61.7% | 37.2% |
| Mean | 25.4% | 13.4% |
| Median | 18.1% | 12.2% |
| Interquartile 25% (IQ1) | 14.0% | 8.1% |
| Interquartile 75% (IQ3) | 39.9% | 16.3% |
| Interquartile Range (IQR) | 25.9% | 8.2% |
| Standard Deviation (Sample) | 15.2% | 7.6% |
| Standard Deviation (Population) | 14.9% | 7.6% |
Similar Demographics by Single Male Poverty
Demographics Similar to Kiowa by Single Male Poverty
In terms of single male poverty, the demographic groups most similar to Kiowa are Colville (18.4%, a difference of 0.73%), Menominee (17.7%, a difference of 3.3%), Cajun (19.1%, a difference of 4.2%), Paiute (19.3%, a difference of 5.4%), and Central American Indian (17.2%, a difference of 6.1%).
| Demographics | Rating | Rank | Single Male Poverty |
| Osage | 0.0 /100 | #321 | Tragic 16.5% |
| Shoshone | 0.0 /100 | #322 | Tragic 16.7% |
| Creek | 0.0 /100 | #323 | Tragic 16.8% |
| Immigrants | Yemen | 0.0 /100 | #324 | Tragic 16.9% |
| Choctaw | 0.0 /100 | #325 | Tragic 17.0% |
| Central American Indians | 0.0 /100 | #326 | Tragic 17.2% |
| Menominee | 0.0 /100 | #327 | Tragic 17.7% |
| Kiowa | 0.0 /100 | #328 | Tragic 18.3% |
| Colville | 0.0 /100 | #329 | Tragic 18.4% |
| Cajuns | 0.0 /100 | #330 | Tragic 19.1% |
| Paiute | 0.0 /100 | #331 | Tragic 19.3% |
| Natives/Alaskans | 0.0 /100 | #332 | Tragic 19.6% |
| Inupiat | 0.0 /100 | #333 | Tragic 20.0% |
| Pima | 0.0 /100 | #334 | Tragic 20.2% |
| Yuman | 0.0 /100 | #335 | Tragic 21.3% |
Demographics Similar to Immigrants from Bangladesh by Single Male Poverty
In terms of single male poverty, the demographic groups most similar to Immigrants from Bangladesh are Estonian (13.0%, a difference of 0.0%), Basque (13.0%, a difference of 0.030%), Trinidadian and Tobagonian (13.0%, a difference of 0.090%), Polish (13.0%, a difference of 0.090%), and Slovene (13.0%, a difference of 0.10%).
| Demographics | Rating | Rank | Single Male Poverty |
| Immigrants | Grenada | 23.1 /100 | #196 | Fair 13.0% |
| Immigrants | Laos | 23.1 /100 | #197 | Fair 13.0% |
| Lithuanians | 22.1 /100 | #198 | Fair 13.0% |
| Immigrants | Norway | 21.8 /100 | #199 | Fair 13.0% |
| Slovenes | 21.6 /100 | #200 | Fair 13.0% |
| Trinidadians and Tobagonians | 21.4 /100 | #201 | Fair 13.0% |
| Basques | 20.7 /100 | #202 | Fair 13.0% |
| Immigrants | Bangladesh | 20.4 /100 | #203 | Fair 13.0% |
| Estonians | 20.3 /100 | #204 | Fair 13.0% |
| Poles | 19.3 /100 | #205 | Poor 13.0% |
| Northern Europeans | 18.9 /100 | #206 | Poor 13.0% |
| Sudanese | 17.7 /100 | #207 | Poor 13.1% |
| Immigrants | Western Africa | 17.6 /100 | #208 | Poor 13.1% |
| Mexican American Indians | 17.5 /100 | #209 | Poor 13.1% |
| Immigrants | Haiti | 16.8 /100 | #210 | Poor 13.1% |