Kenyan vs Immigrants from Uruguay Professional Degree
COMPARE
Kenyan
Immigrants from Uruguay
Professional Degree
Professional Degree Comparison
Kenyans
Immigrants from Uruguay
4.4%
PROFESSIONAL DEGREE
50.0/ 100
METRIC RATING
174th/ 347
METRIC RANK
4.6%
PROFESSIONAL DEGREE
72.5/ 100
METRIC RATING
153rd/ 347
METRIC RANK
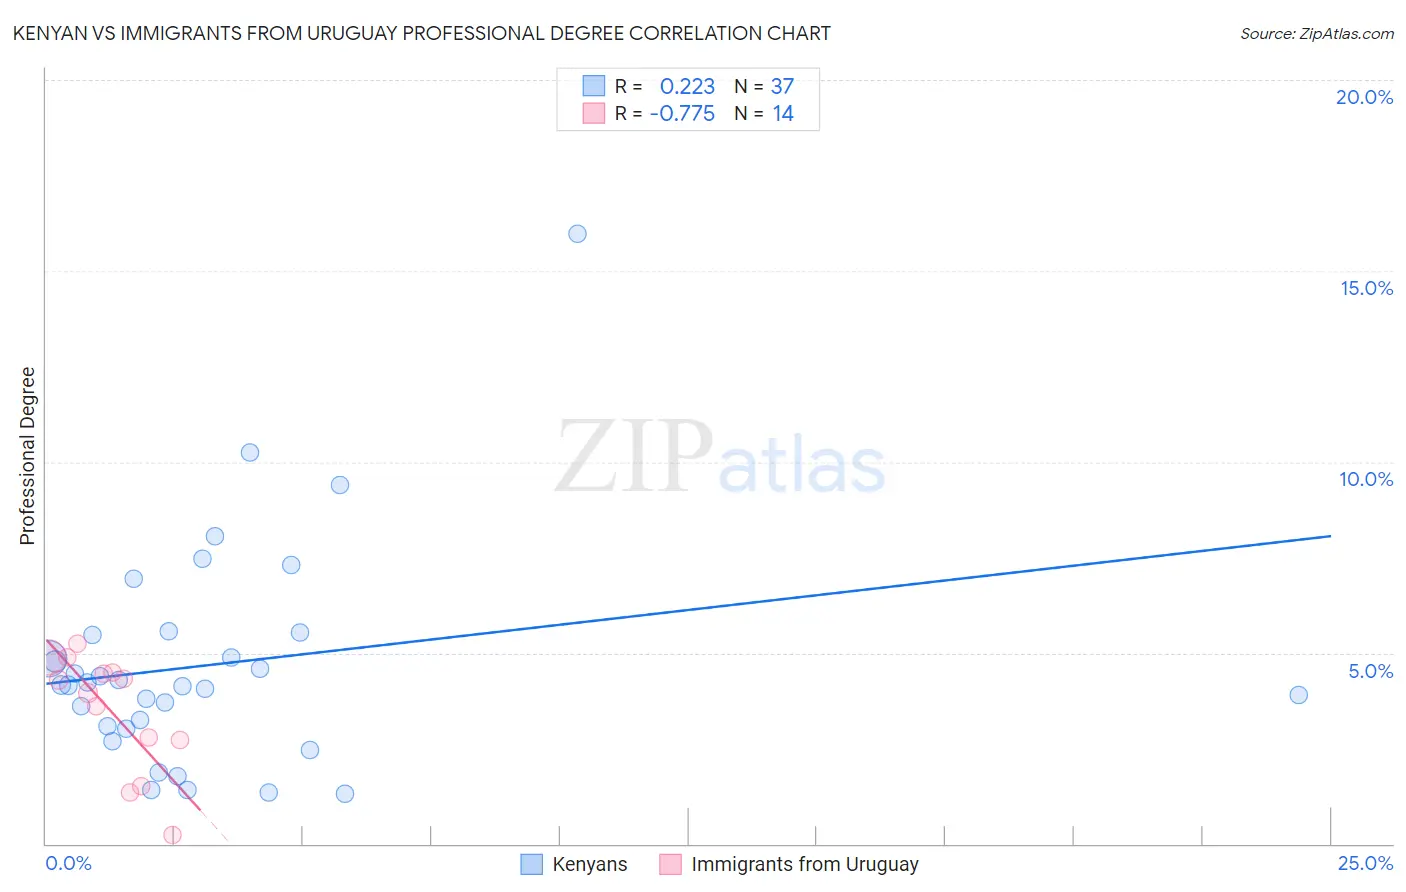
Kenyan vs Immigrants from Uruguay Professional Degree Correlation Chart
The statistical analysis conducted on geographies consisting of 168,089,773 people shows a weak positive correlation between the proportion of Kenyans and percentage of population with at least professional degree education in the United States with a correlation coefficient (R) of 0.223 and weighted average of 4.4%. Similarly, the statistical analysis conducted on geographies consisting of 133,217,202 people shows a strong negative correlation between the proportion of Immigrants from Uruguay and percentage of population with at least professional degree education in the United States with a correlation coefficient (R) of -0.775 and weighted average of 4.6%, a difference of 3.5%.
Professional Degree Correlation Summary
| Measurement | Kenyan | Immigrants from Uruguay |
| Minimum | 1.3% | 0.22% |
| Maximum | 16.0% | 5.3% |
| Range | 14.7% | 5.0% |
| Mean | 4.7% | 3.5% |
| Median | 4.2% | 4.1% |
| Interquartile 25% (IQ1) | 3.0% | 2.7% |
| Interquartile 75% (IQ3) | 5.5% | 4.5% |
| Interquartile Range (IQR) | 2.5% | 1.8% |
| Standard Deviation (Sample) | 2.9% | 1.5% |
| Standard Deviation (Population) | 2.8% | 1.5% |
Similar Demographics by Professional Degree
Demographics Similar to Kenyans by Professional Degree
In terms of professional degree, the demographic groups most similar to Kenyans are Irish (4.4%, a difference of 0.0%), English (4.4%, a difference of 0.010%), Immigrants from Peru (4.4%, a difference of 0.10%), Spaniard (4.4%, a difference of 0.29%), and Celtic (4.4%, a difference of 0.35%).
| Demographics | Rating | Rank | Professional Degree |
| Immigrants | Afghanistan | 59.2 /100 | #167 | Average 4.5% |
| Immigrants | Sierra Leone | 58.7 /100 | #168 | Average 4.5% |
| Chinese | 58.6 /100 | #169 | Average 4.5% |
| Immigrants | Zaire | 57.4 /100 | #170 | Average 4.5% |
| Immigrants | Bangladesh | 56.0 /100 | #171 | Average 4.4% |
| Spaniards | 52.0 /100 | #172 | Average 4.4% |
| English | 50.1 /100 | #173 | Average 4.4% |
| Kenyans | 50.0 /100 | #174 | Average 4.4% |
| Irish | 50.0 /100 | #175 | Average 4.4% |
| Immigrants | Peru | 49.3 /100 | #176 | Average 4.4% |
| Celtics | 47.6 /100 | #177 | Average 4.4% |
| Immigrants | Costa Rica | 46.7 /100 | #178 | Average 4.4% |
| Immigrants | Kenya | 45.9 /100 | #179 | Average 4.4% |
| Czechs | 44.9 /100 | #180 | Average 4.4% |
| Danes | 43.5 /100 | #181 | Average 4.4% |
Demographics Similar to Immigrants from Uruguay by Professional Degree
In terms of professional degree, the demographic groups most similar to Immigrants from Uruguay are Immigrants from Africa (4.6%, a difference of 0.0%), Polish (4.6%, a difference of 0.020%), Scottish (4.6%, a difference of 0.12%), Immigrants from Oceania (4.6%, a difference of 0.16%), and Slavic (4.5%, a difference of 0.30%).
| Demographics | Rating | Rank | Professional Degree |
| Luxembourgers | 78.7 /100 | #146 | Good 4.6% |
| Colombians | 77.7 /100 | #147 | Good 4.6% |
| Slovenes | 76.1 /100 | #148 | Good 4.6% |
| Senegalese | 75.3 /100 | #149 | Good 4.6% |
| Immigrants | Oceania | 73.4 /100 | #150 | Good 4.6% |
| Poles | 72.6 /100 | #151 | Good 4.6% |
| Immigrants | Africa | 72.5 /100 | #152 | Good 4.6% |
| Immigrants | Uruguay | 72.5 /100 | #153 | Good 4.6% |
| Scottish | 71.8 /100 | #154 | Good 4.6% |
| Slavs | 70.8 /100 | #155 | Good 4.5% |
| Swedes | 69.9 /100 | #156 | Good 4.5% |
| Iraqis | 69.8 /100 | #157 | Good 4.5% |
| Immigrants | Armenia | 68.8 /100 | #158 | Good 4.5% |
| Vietnamese | 68.4 /100 | #159 | Good 4.5% |
| Immigrants | Senegal | 68.0 /100 | #160 | Good 4.5% |