Kenyan vs Dominican Child Poverty Among Girls Under 16
COMPARE
Kenyan
Dominican
Child Poverty Among Girls Under 16
Child Poverty Among Girls Under 16 Comparison
Kenyans
Dominicans
16.8%
CHILD POVERTY AMONG GIRLS UNDER 16
32.3/ 100
METRIC RATING
190th/ 347
METRIC RANK
23.7%
CHILD POVERTY AMONG GIRLS UNDER 16
0.0/ 100
METRIC RATING
328th/ 347
METRIC RANK
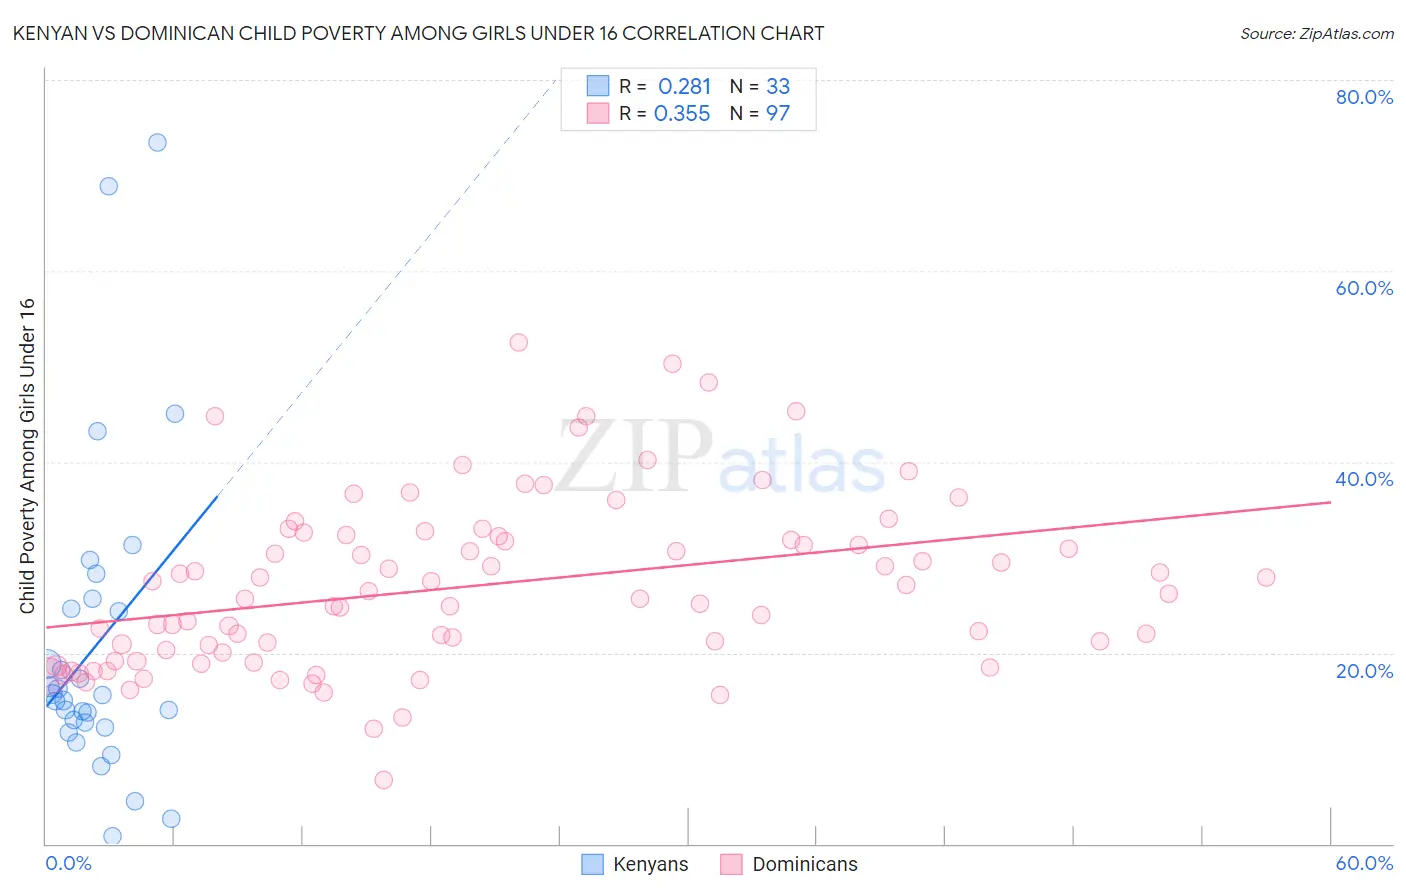
Kenyan vs Dominican Child Poverty Among Girls Under 16 Correlation Chart
The statistical analysis conducted on geographies consisting of 167,122,330 people shows a weak positive correlation between the proportion of Kenyans and poverty level among girls under the age of 16 in the United States with a correlation coefficient (R) of 0.281 and weighted average of 16.8%. Similarly, the statistical analysis conducted on geographies consisting of 349,076,345 people shows a mild positive correlation between the proportion of Dominicans and poverty level among girls under the age of 16 in the United States with a correlation coefficient (R) of 0.355 and weighted average of 23.7%, a difference of 40.7%.
Child Poverty Among Girls Under 16 Correlation Summary
| Measurement | Kenyan | Dominican |
| Minimum | 0.77% | 6.6% |
| Maximum | 73.5% | 52.5% |
| Range | 72.7% | 45.9% |
| Mean | 20.7% | 27.0% |
| Median | 15.6% | 26.2% |
| Interquartile 25% (IQ1) | 12.4% | 19.6% |
| Interquartile 75% (IQ3) | 25.1% | 32.2% |
| Interquartile Range (IQR) | 12.7% | 12.6% |
| Standard Deviation (Sample) | 16.3% | 9.0% |
| Standard Deviation (Population) | 16.1% | 8.9% |
Similar Demographics by Child Poverty Among Girls Under 16
Demographics Similar to Kenyans by Child Poverty Among Girls Under 16
In terms of child poverty among girls under 16, the demographic groups most similar to Kenyans are Immigrants from Bosnia and Herzegovina (16.8%, a difference of 0.040%), Immigrants from the Azores (16.8%, a difference of 0.12%), Immigrants from Uganda (16.8%, a difference of 0.13%), Immigrants from Morocco (16.8%, a difference of 0.29%), and Arab (16.8%, a difference of 0.29%).
| Demographics | Rating | Rank | Child Poverty Among Girls Under 16 |
| Immigrants | Portugal | 42.5 /100 | #183 | Average 16.6% |
| Scotch-Irish | 39.6 /100 | #184 | Fair 16.7% |
| Immigrants | Uruguay | 35.6 /100 | #185 | Fair 16.7% |
| South American Indians | 35.0 /100 | #186 | Fair 16.8% |
| Immigrants | Morocco | 34.6 /100 | #187 | Fair 16.8% |
| Arabs | 34.5 /100 | #188 | Fair 16.8% |
| Immigrants | Bosnia and Herzegovina | 32.5 /100 | #189 | Fair 16.8% |
| Kenyans | 32.3 /100 | #190 | Fair 16.8% |
| Immigrants | Azores | 31.3 /100 | #191 | Fair 16.8% |
| Immigrants | Uganda | 31.3 /100 | #192 | Fair 16.8% |
| Aleuts | 28.7 /100 | #193 | Fair 16.9% |
| Spanish | 28.6 /100 | #194 | Fair 16.9% |
| Immigrants | Costa Rica | 25.6 /100 | #195 | Fair 17.0% |
| Celtics | 25.2 /100 | #196 | Fair 17.0% |
| Spaniards | 24.9 /100 | #197 | Fair 17.0% |
Demographics Similar to Dominicans by Child Poverty Among Girls Under 16
In terms of child poverty among girls under 16, the demographic groups most similar to Dominicans are Kiowa (23.7%, a difference of 0.12%), Immigrants from Dominican Republic (23.8%, a difference of 0.65%), Apache (23.8%, a difference of 0.70%), Native/Alaskan (24.0%, a difference of 1.6%), and Central American Indian (22.8%, a difference of 3.8%).
| Demographics | Rating | Rank | Child Poverty Among Girls Under 16 |
| Colville | 0.0 /100 | #321 | Tragic 22.5% |
| Yakama | 0.0 /100 | #322 | Tragic 22.6% |
| Cajuns | 0.0 /100 | #323 | Tragic 22.6% |
| Paiute | 0.0 /100 | #324 | Tragic 22.6% |
| Immigrants | Congo | 0.0 /100 | #325 | Tragic 22.7% |
| Immigrants | Honduras | 0.0 /100 | #326 | Tragic 22.8% |
| Central American Indians | 0.0 /100 | #327 | Tragic 22.8% |
| Dominicans | 0.0 /100 | #328 | Tragic 23.7% |
| Kiowa | 0.0 /100 | #329 | Tragic 23.7% |
| Immigrants | Dominican Republic | 0.0 /100 | #330 | Tragic 23.8% |
| Apache | 0.0 /100 | #331 | Tragic 23.8% |
| Natives/Alaskans | 0.0 /100 | #332 | Tragic 24.0% |
| Blacks/African Americans | 0.0 /100 | #333 | Tragic 24.7% |
| Menominee | 0.0 /100 | #334 | Tragic 25.0% |
| Pueblo | 0.0 /100 | #335 | Tragic 25.2% |