Jordanian vs Jamaican Child Poverty Among Girls Under 16
COMPARE
Jordanian
Jamaican
Child Poverty Among Girls Under 16
Child Poverty Among Girls Under 16 Comparison
Jordanians
Jamaicans
14.8%
CHILD POVERTY AMONG GIRLS UNDER 16
97.1/ 100
METRIC RATING
89th/ 347
METRIC RANK
19.7%
CHILD POVERTY AMONG GIRLS UNDER 16
0.1/ 100
METRIC RATING
264th/ 347
METRIC RANK
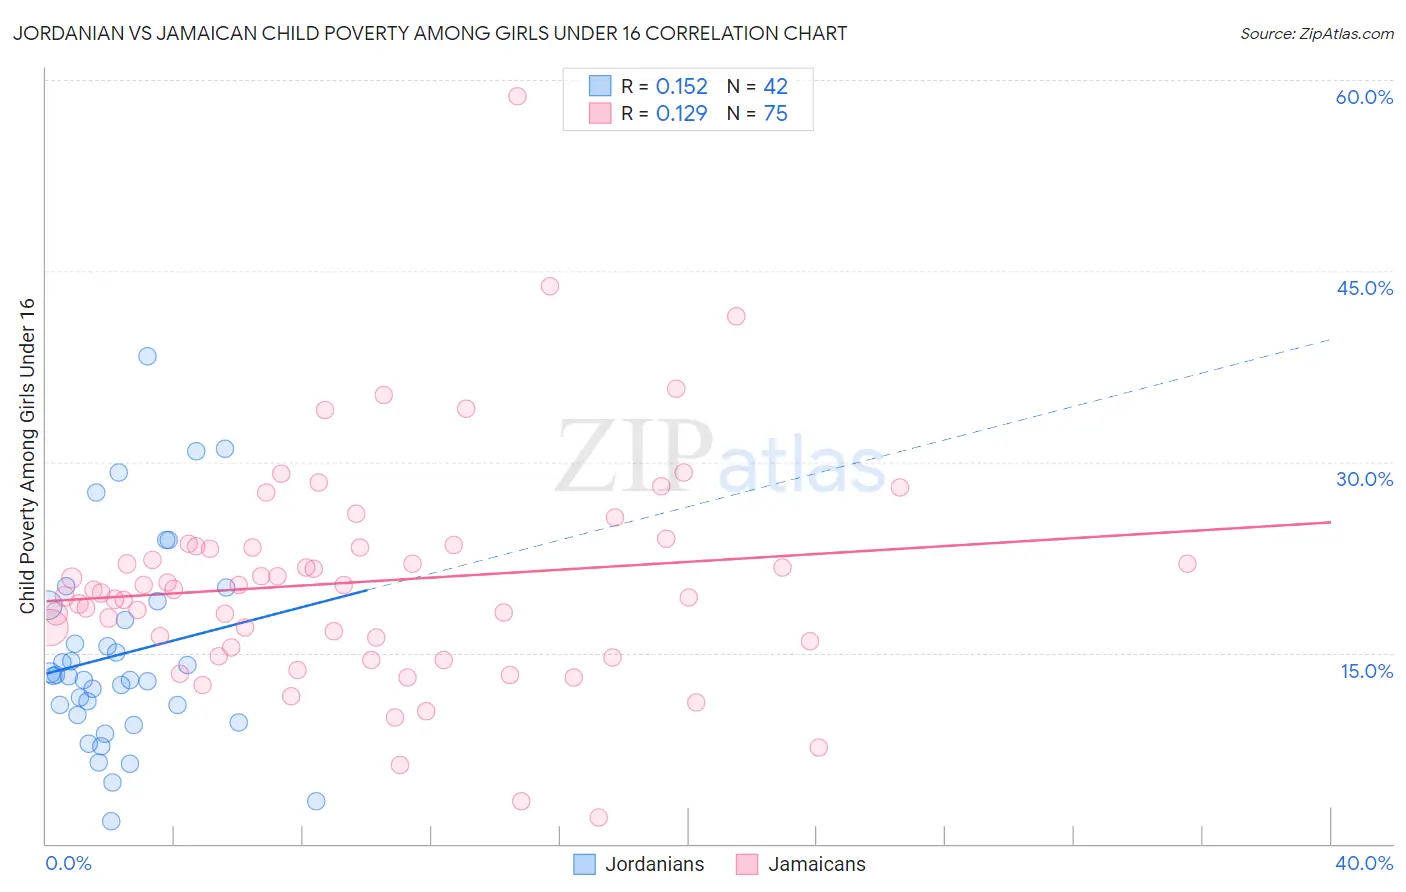
Jordanian vs Jamaican Child Poverty Among Girls Under 16 Correlation Chart
The statistical analysis conducted on geographies consisting of 165,455,872 people shows a poor positive correlation between the proportion of Jordanians and poverty level among girls under the age of 16 in the United States with a correlation coefficient (R) of 0.152 and weighted average of 14.8%. Similarly, the statistical analysis conducted on geographies consisting of 362,780,888 people shows a poor positive correlation between the proportion of Jamaicans and poverty level among girls under the age of 16 in the United States with a correlation coefficient (R) of 0.129 and weighted average of 19.7%, a difference of 32.8%.
Child Poverty Among Girls Under 16 Correlation Summary
| Measurement | Jordanian | Jamaican |
| Minimum | 1.7% | 2.1% |
| Maximum | 38.3% | 58.8% |
| Range | 36.5% | 56.7% |
| Mean | 14.9% | 20.6% |
| Median | 13.2% | 19.9% |
| Interquartile 25% (IQ1) | 10.1% | 15.4% |
| Interquartile 75% (IQ3) | 18.7% | 23.4% |
| Interquartile Range (IQR) | 8.6% | 8.0% |
| Standard Deviation (Sample) | 7.9% | 8.8% |
| Standard Deviation (Population) | 7.8% | 8.8% |
Similar Demographics by Child Poverty Among Girls Under 16
Demographics Similar to Jordanians by Child Poverty Among Girls Under 16
In terms of child poverty among girls under 16, the demographic groups most similar to Jordanians are Northern European (14.8%, a difference of 0.020%), Immigrants from Canada (14.8%, a difference of 0.050%), Immigrants from Belarus (14.8%, a difference of 0.060%), Finnish (14.8%, a difference of 0.12%), and Australian (14.8%, a difference of 0.14%).
| Demographics | Rating | Rank | Child Poverty Among Girls Under 16 |
| Macedonians | 97.6 /100 | #82 | Exceptional 14.7% |
| Immigrants | Italy | 97.4 /100 | #83 | Exceptional 14.8% |
| Soviet Union | 97.3 /100 | #84 | Exceptional 14.8% |
| Swiss | 97.2 /100 | #85 | Exceptional 14.8% |
| Australians | 97.2 /100 | #86 | Exceptional 14.8% |
| Finns | 97.2 /100 | #87 | Exceptional 14.8% |
| Immigrants | Canada | 97.1 /100 | #88 | Exceptional 14.8% |
| Jordanians | 97.1 /100 | #89 | Exceptional 14.8% |
| Northern Europeans | 97.0 /100 | #90 | Exceptional 14.8% |
| Immigrants | Belarus | 97.0 /100 | #91 | Exceptional 14.8% |
| Austrians | 96.7 /100 | #92 | Exceptional 14.9% |
| Immigrants | North America | 96.6 /100 | #93 | Exceptional 14.9% |
| Immigrants | Switzerland | 96.3 /100 | #94 | Exceptional 14.9% |
| Germans | 96.3 /100 | #95 | Exceptional 14.9% |
| Immigrants | France | 96.2 /100 | #96 | Exceptional 14.9% |
Demographics Similar to Jamaicans by Child Poverty Among Girls Under 16
In terms of child poverty among girls under 16, the demographic groups most similar to Jamaicans are Immigrants from Burma/Myanmar (19.7%, a difference of 0.11%), Chickasaw (19.6%, a difference of 0.23%), Immigrants from Jamaica (19.8%, a difference of 0.43%), Spanish American (19.8%, a difference of 0.68%), and Vietnamese (19.5%, a difference of 0.76%).
| Demographics | Rating | Rank | Child Poverty Among Girls Under 16 |
| Guyanese | 0.2 /100 | #257 | Tragic 19.4% |
| Salvadorans | 0.2 /100 | #258 | Tragic 19.4% |
| Ottawa | 0.2 /100 | #259 | Tragic 19.4% |
| Mexican American Indians | 0.2 /100 | #260 | Tragic 19.5% |
| Vietnamese | 0.2 /100 | #261 | Tragic 19.5% |
| Chickasaw | 0.1 /100 | #262 | Tragic 19.6% |
| Immigrants | Burma/Myanmar | 0.1 /100 | #263 | Tragic 19.7% |
| Jamaicans | 0.1 /100 | #264 | Tragic 19.7% |
| Immigrants | Jamaica | 0.1 /100 | #265 | Tragic 19.8% |
| Spanish Americans | 0.1 /100 | #266 | Tragic 19.8% |
| Immigrants | Bangladesh | 0.1 /100 | #267 | Tragic 19.9% |
| Spanish American Indians | 0.1 /100 | #268 | Tragic 19.9% |
| Liberians | 0.1 /100 | #269 | Tragic 19.9% |
| Cherokee | 0.1 /100 | #270 | Tragic 19.9% |
| Immigrants | Barbados | 0.1 /100 | #271 | Tragic 19.9% |