Japanese vs Bolivian Female Poverty
COMPARE
Japanese
Bolivian
Female Poverty
Female Poverty Comparison
Japanese
Bolivians
14.5%
FEMALE POVERTY
4.1/ 100
METRIC RATING
219th/ 347
METRIC RANK
11.5%
FEMALE POVERTY
99.8/ 100
METRIC RATING
17th/ 347
METRIC RANK
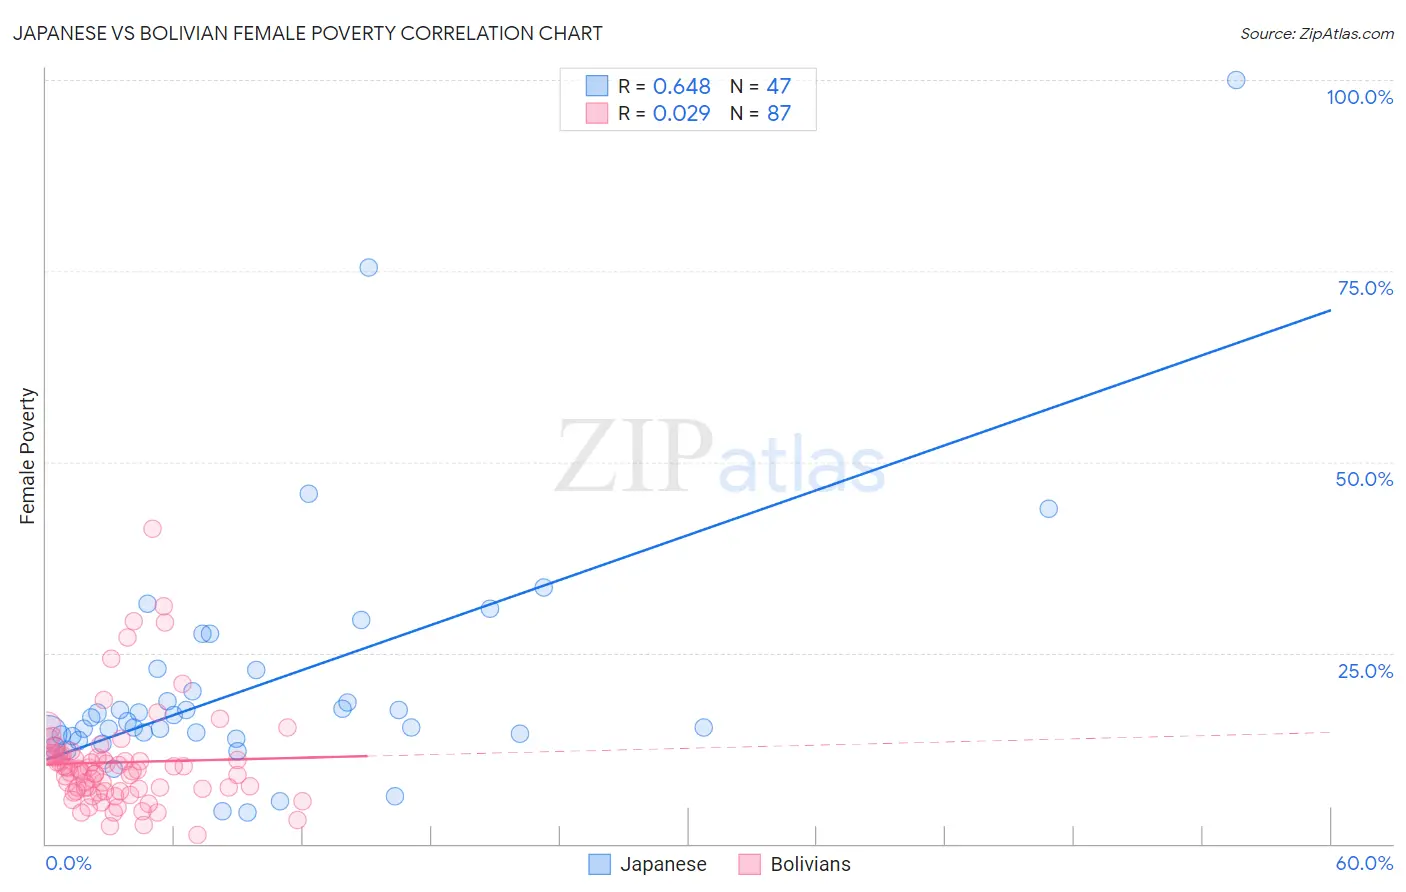
Japanese vs Bolivian Female Poverty Correlation Chart
The statistical analysis conducted on geographies consisting of 249,060,032 people shows a significant positive correlation between the proportion of Japanese and poverty level among females in the United States with a correlation coefficient (R) of 0.648 and weighted average of 14.5%. Similarly, the statistical analysis conducted on geographies consisting of 184,615,505 people shows no correlation between the proportion of Bolivians and poverty level among females in the United States with a correlation coefficient (R) of 0.029 and weighted average of 11.5%, a difference of 25.8%.
Female Poverty Correlation Summary
| Measurement | Japanese | Bolivian |
| Minimum | 4.1% | 1.1% |
| Maximum | 100.0% | 41.2% |
| Range | 95.9% | 40.1% |
| Mean | 21.0% | 10.7% |
| Median | 16.0% | 9.7% |
| Interquartile 25% (IQ1) | 14.2% | 6.9% |
| Interquartile 75% (IQ3) | 22.7% | 11.6% |
| Interquartile Range (IQR) | 8.6% | 4.7% |
| Standard Deviation (Sample) | 16.8% | 6.6% |
| Standard Deviation (Population) | 16.7% | 6.5% |
Similar Demographics by Female Poverty
Demographics Similar to Japanese by Female Poverty
In terms of female poverty, the demographic groups most similar to Japanese are Alsatian (14.5%, a difference of 0.050%), Immigrants from Uzbekistan (14.4%, a difference of 0.14%), Immigrants (14.4%, a difference of 0.19%), Immigrants from Thailand (14.4%, a difference of 0.22%), and Immigrants from Cambodia (14.5%, a difference of 0.24%).
| Demographics | Rating | Rank | Female Poverty |
| Bermudans | 5.5 /100 | #212 | Tragic 14.4% |
| Alaskan Athabascans | 5.3 /100 | #213 | Tragic 14.4% |
| Marshallese | 5.0 /100 | #214 | Tragic 14.4% |
| Immigrants | Panama | 4.7 /100 | #215 | Tragic 14.4% |
| Immigrants | Thailand | 4.5 /100 | #216 | Tragic 14.4% |
| Immigrants | Immigrants | 4.5 /100 | #217 | Tragic 14.4% |
| Immigrants | Uzbekistan | 4.4 /100 | #218 | Tragic 14.4% |
| Japanese | 4.1 /100 | #219 | Tragic 14.5% |
| Alsatians | 4.0 /100 | #220 | Tragic 14.5% |
| Immigrants | Cambodia | 3.7 /100 | #221 | Tragic 14.5% |
| Immigrants | Nonimmigrants | 3.7 /100 | #222 | Tragic 14.5% |
| Immigrants | Africa | 3.3 /100 | #223 | Tragic 14.5% |
| Americans | 2.8 /100 | #224 | Tragic 14.6% |
| Immigrants | Micronesia | 2.8 /100 | #225 | Tragic 14.6% |
| Immigrants | Eritrea | 2.4 /100 | #226 | Tragic 14.6% |
Demographics Similar to Bolivians by Female Poverty
In terms of female poverty, the demographic groups most similar to Bolivians are Immigrants from Scotland (11.5%, a difference of 0.050%), Immigrants from Bolivia (11.5%, a difference of 0.070%), Norwegian (11.5%, a difference of 0.090%), Eastern European (11.5%, a difference of 0.32%), and Latvian (11.4%, a difference of 0.54%).
| Demographics | Rating | Rank | Female Poverty |
| Immigrants | Hong Kong | 99.9 /100 | #10 | Exceptional 11.2% |
| Maltese | 99.9 /100 | #11 | Exceptional 11.2% |
| Bhutanese | 99.9 /100 | #12 | Exceptional 11.3% |
| Immigrants | Lithuania | 99.9 /100 | #13 | Exceptional 11.3% |
| Lithuanians | 99.8 /100 | #14 | Exceptional 11.4% |
| Latvians | 99.8 /100 | #15 | Exceptional 11.4% |
| Immigrants | Bolivia | 99.8 /100 | #16 | Exceptional 11.5% |
| Bolivians | 99.8 /100 | #17 | Exceptional 11.5% |
| Immigrants | Scotland | 99.8 /100 | #18 | Exceptional 11.5% |
| Norwegians | 99.8 /100 | #19 | Exceptional 11.5% |
| Eastern Europeans | 99.7 /100 | #20 | Exceptional 11.5% |
| Italians | 99.7 /100 | #21 | Exceptional 11.6% |
| Swedes | 99.7 /100 | #22 | Exceptional 11.6% |
| Burmese | 99.7 /100 | #23 | Exceptional 11.6% |
| Luxembourgers | 99.7 /100 | #24 | Exceptional 11.6% |