Spaniard vs Immigrants from Belize Single Mother Poverty
COMPARE
Spaniard
Immigrants from Belize
Single Mother Poverty
Single Mother Poverty Comparison
Spaniards
Immigrants from Belize
30.2%
SINGLE MOTHER POVERTY
5.4/ 100
METRIC RATING
228th/ 347
METRIC RANK
31.4%
SINGLE MOTHER POVERTY
0.2/ 100
METRIC RATING
267th/ 347
METRIC RANK
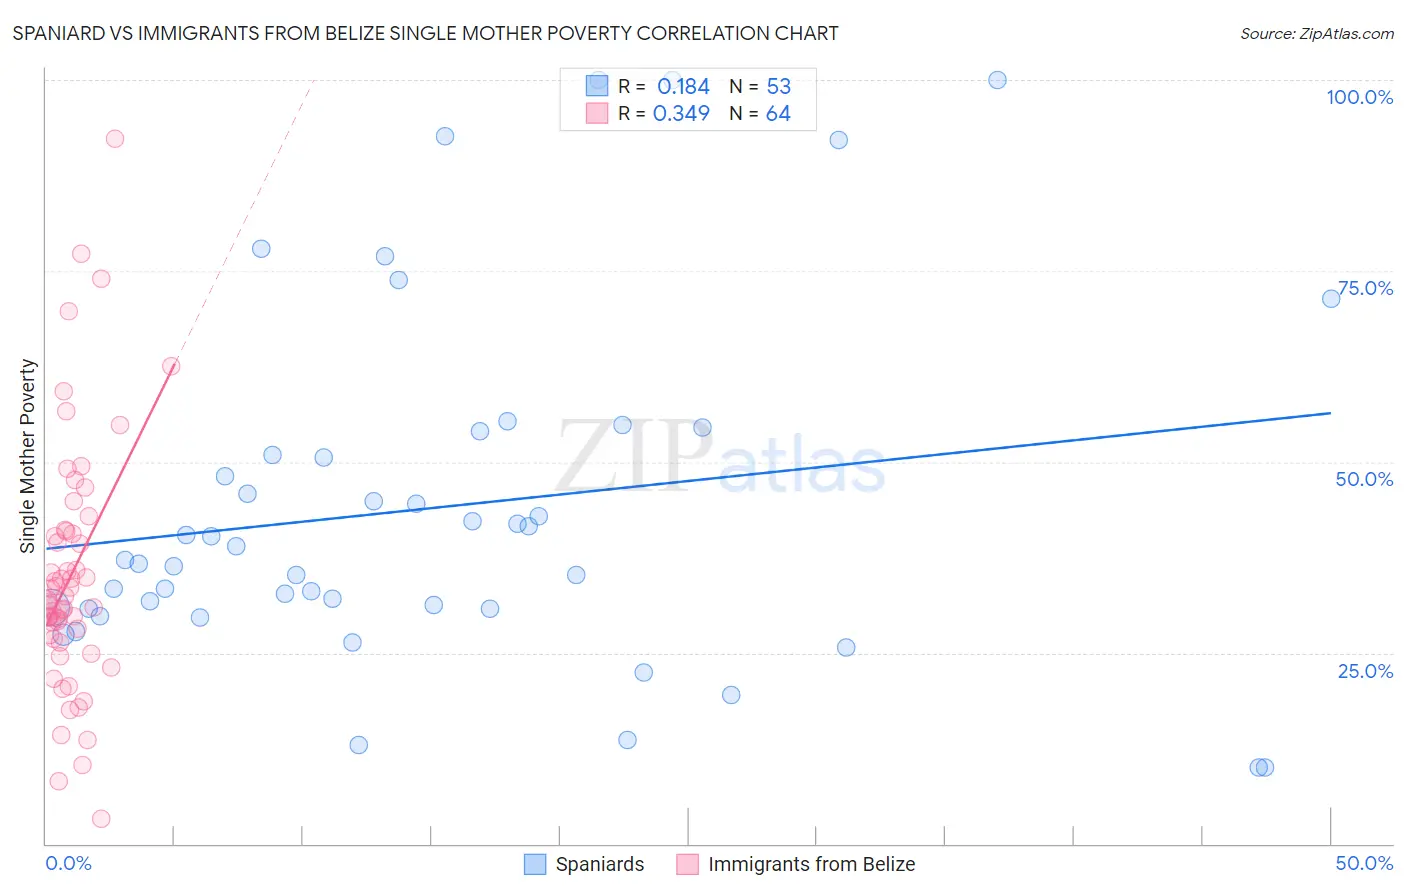
Spaniard vs Immigrants from Belize Single Mother Poverty Correlation Chart
The statistical analysis conducted on geographies consisting of 431,071,159 people shows a poor positive correlation between the proportion of Spaniards and poverty level among single mothers in the United States with a correlation coefficient (R) of 0.184 and weighted average of 30.2%. Similarly, the statistical analysis conducted on geographies consisting of 129,542,917 people shows a mild positive correlation between the proportion of Immigrants from Belize and poverty level among single mothers in the United States with a correlation coefficient (R) of 0.349 and weighted average of 31.4%, a difference of 4.1%.
Single Mother Poverty Correlation Summary
| Measurement | Spaniard | Immigrants from Belize |
| Minimum | 10.0% | 3.2% |
| Maximum | 100.0% | 92.3% |
| Range | 90.0% | 89.1% |
| Mean | 44.0% | 35.1% |
| Median | 37.1% | 31.7% |
| Interquartile 25% (IQ1) | 30.8% | 27.1% |
| Interquartile 75% (IQ3) | 52.5% | 40.7% |
| Interquartile Range (IQR) | 21.7% | 13.5% |
| Standard Deviation (Sample) | 22.9% | 16.3% |
| Standard Deviation (Population) | 22.7% | 16.1% |
Similar Demographics by Single Mother Poverty
Demographics Similar to Spaniards by Single Mother Poverty
In terms of single mother poverty, the demographic groups most similar to Spaniards are Immigrants from Barbados (30.2%, a difference of 0.090%), Immigrants from Liberia (30.1%, a difference of 0.11%), English (30.2%, a difference of 0.13%), Scottish (30.1%, a difference of 0.14%), and Spanish (30.1%, a difference of 0.20%).
| Demographics | Rating | Rank | Single Mother Poverty |
| Immigrants | Eritrea | 7.7 /100 | #221 | Tragic 30.0% |
| Sudanese | 7.6 /100 | #222 | Tragic 30.0% |
| Immigrants | Cuba | 6.9 /100 | #223 | Tragic 30.1% |
| Immigrants | Sudan | 6.5 /100 | #224 | Tragic 30.1% |
| Spanish | 6.3 /100 | #225 | Tragic 30.1% |
| Scottish | 6.0 /100 | #226 | Tragic 30.1% |
| Immigrants | Liberia | 5.9 /100 | #227 | Tragic 30.1% |
| Spaniards | 5.4 /100 | #228 | Tragic 30.2% |
| Immigrants | Barbados | 5.0 /100 | #229 | Tragic 30.2% |
| English | 4.8 /100 | #230 | Tragic 30.2% |
| Dutch | 4.3 /100 | #231 | Tragic 30.2% |
| Alaskan Athabascans | 4.1 /100 | #232 | Tragic 30.3% |
| Immigrants | Middle Africa | 3.5 /100 | #233 | Tragic 30.3% |
| Immigrants | Nicaragua | 3.5 /100 | #234 | Tragic 30.3% |
| Immigrants | Grenada | 3.4 /100 | #235 | Tragic 30.3% |
Demographics Similar to Immigrants from Belize by Single Mother Poverty
In terms of single mother poverty, the demographic groups most similar to Immigrants from Belize are Subsaharan African (31.4%, a difference of 0.15%), Immigrants from Senegal (31.5%, a difference of 0.18%), German Russian (31.3%, a difference of 0.22%), Scotch-Irish (31.5%, a difference of 0.22%), and Immigrants from Ecuador (31.3%, a difference of 0.25%).
| Demographics | Rating | Rank | Single Mother Poverty |
| Whites/Caucasians | 0.3 /100 | #260 | Tragic 31.2% |
| Immigrants | El Salvador | 0.3 /100 | #261 | Tragic 31.2% |
| Hmong | 0.3 /100 | #262 | Tragic 31.2% |
| Bahamians | 0.2 /100 | #263 | Tragic 31.3% |
| Immigrants | Ecuador | 0.2 /100 | #264 | Tragic 31.3% |
| German Russians | 0.2 /100 | #265 | Tragic 31.3% |
| Sub-Saharan Africans | 0.2 /100 | #266 | Tragic 31.4% |
| Immigrants | Belize | 0.2 /100 | #267 | Tragic 31.4% |
| Immigrants | Senegal | 0.1 /100 | #268 | Tragic 31.5% |
| Scotch-Irish | 0.1 /100 | #269 | Tragic 31.5% |
| British West Indians | 0.1 /100 | #270 | Tragic 31.5% |
| Immigrants | Cabo Verde | 0.1 /100 | #271 | Tragic 31.6% |
| Immigrants | Micronesia | 0.1 /100 | #272 | Tragic 31.6% |
| Fijians | 0.1 /100 | #273 | Tragic 31.6% |
| Bangladeshis | 0.1 /100 | #274 | Tragic 31.7% |