Japanese vs Dutch Unemployment Among Seniors over 75 years
COMPARE
Japanese
Dutch
Unemployment Among Seniors over 75 years
Unemployment Among Seniors over 75 years Comparison
Japanese
Dutch
8.3%
UNEMPLOYMENT AMONG SENIORS OVER 75 YEARS
97.5/ 100
METRIC RATING
119th/ 347
METRIC RANK
10.4%
UNEMPLOYMENT AMONG SENIORS OVER 75 YEARS
0.0/ 100
METRIC RATING
327th/ 347
METRIC RANK
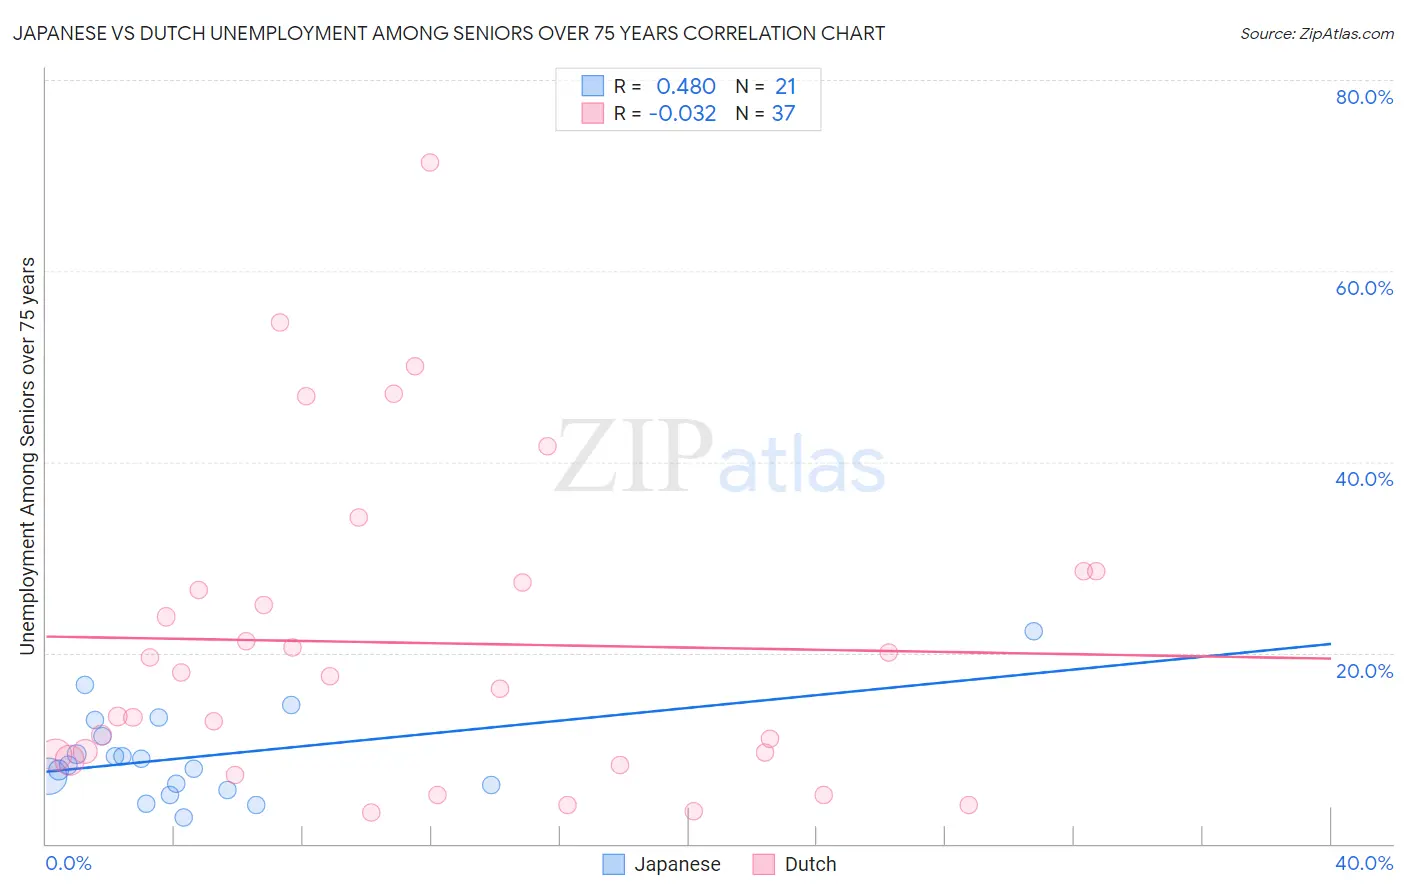
Japanese vs Dutch Unemployment Among Seniors over 75 years Correlation Chart
The statistical analysis conducted on geographies consisting of 149,299,212 people shows a moderate positive correlation between the proportion of Japanese and unemployment rate among seniors over the age of 75 in the United States with a correlation coefficient (R) of 0.480 and weighted average of 8.3%. Similarly, the statistical analysis conducted on geographies consisting of 231,890,599 people shows no correlation between the proportion of Dutch and unemployment rate among seniors over the age of 75 in the United States with a correlation coefficient (R) of -0.032 and weighted average of 10.4%, a difference of 25.4%.
Unemployment Among Seniors over 75 years Correlation Summary
| Measurement | Japanese | Dutch |
| Minimum | 2.8% | 3.3% |
| Maximum | 22.2% | 71.4% |
| Range | 19.4% | 68.1% |
| Mean | 9.2% | 21.0% |
| Median | 8.2% | 17.6% |
| Interquartile 25% (IQ1) | 5.8% | 9.0% |
| Interquartile 75% (IQ3) | 12.1% | 27.9% |
| Interquartile Range (IQR) | 6.2% | 18.9% |
| Standard Deviation (Sample) | 4.7% | 16.4% |
| Standard Deviation (Population) | 4.6% | 16.2% |
Similar Demographics by Unemployment Among Seniors over 75 years
Demographics Similar to Japanese by Unemployment Among Seniors over 75 years
In terms of unemployment among seniors over 75 years, the demographic groups most similar to Japanese are Immigrants from Asia (8.3%, a difference of 0.020%), Immigrants from Croatia (8.3%, a difference of 0.15%), Immigrants from Russia (8.3%, a difference of 0.21%), Immigrants from Middle Africa (8.3%, a difference of 0.27%), and Immigrants from Nepal (8.3%, a difference of 0.29%).
| Demographics | Rating | Rank | Unemployment Among Seniors over 75 years |
| Immigrants | India | 98.6 /100 | #112 | Exceptional 8.2% |
| Asians | 98.5 /100 | #113 | Exceptional 8.3% |
| Trinidadians and Tobagonians | 98.4 /100 | #114 | Exceptional 8.3% |
| Sudanese | 98.2 /100 | #115 | Exceptional 8.3% |
| Immigrants | West Indies | 98.1 /100 | #116 | Exceptional 8.3% |
| Immigrants | Greece | 97.9 /100 | #117 | Exceptional 8.3% |
| Immigrants | Middle Africa | 97.9 /100 | #118 | Exceptional 8.3% |
| Japanese | 97.5 /100 | #119 | Exceptional 8.3% |
| Immigrants | Asia | 97.4 /100 | #120 | Exceptional 8.3% |
| Immigrants | Croatia | 97.2 /100 | #121 | Exceptional 8.3% |
| Immigrants | Russia | 97.1 /100 | #122 | Exceptional 8.3% |
| Immigrants | Nepal | 96.9 /100 | #123 | Exceptional 8.3% |
| Thais | 96.8 /100 | #124 | Exceptional 8.3% |
| Immigrants | Moldova | 96.7 /100 | #125 | Exceptional 8.3% |
| Belizeans | 96.3 /100 | #126 | Exceptional 8.4% |
Demographics Similar to Dutch by Unemployment Among Seniors over 75 years
In terms of unemployment among seniors over 75 years, the demographic groups most similar to Dutch are Slovak (10.4%, a difference of 0.080%), Portuguese (10.4%, a difference of 0.31%), American (10.4%, a difference of 0.51%), Tongan (10.4%, a difference of 0.54%), and Immigrants from Portugal (10.5%, a difference of 0.63%).
| Demographics | Rating | Rank | Unemployment Among Seniors over 75 years |
| French | 0.0 /100 | #320 | Tragic 10.3% |
| Aleuts | 0.0 /100 | #321 | Tragic 10.3% |
| Poles | 0.0 /100 | #322 | Tragic 10.3% |
| Tongans | 0.0 /100 | #323 | Tragic 10.4% |
| Americans | 0.0 /100 | #324 | Tragic 10.4% |
| Portuguese | 0.0 /100 | #325 | Tragic 10.4% |
| Slovaks | 0.0 /100 | #326 | Tragic 10.4% |
| Dutch | 0.0 /100 | #327 | Tragic 10.4% |
| Immigrants | Portugal | 0.0 /100 | #328 | Tragic 10.5% |
| Tsimshian | 0.0 /100 | #329 | Tragic 10.5% |
| Immigrants | Azores | 0.0 /100 | #330 | Tragic 10.7% |
| Tohono O'odham | 0.0 /100 | #331 | Tragic 10.8% |
| Immigrants | Liberia | 0.0 /100 | #332 | Tragic 10.9% |
| Alaskan Athabascans | 0.0 /100 | #333 | Tragic 11.0% |
| Assyrians/Chaldeans/Syriacs | 0.0 /100 | #334 | Tragic 11.1% |