Japanese vs Dutch Seniors Poverty Over the Age of 65
COMPARE
Japanese
Dutch
Seniors Poverty Over the Age of 65
Seniors Poverty Over the Age of 65 Comparison
Japanese
Dutch
12.2%
SENIORS POVERTY OVER THE AGE OF 65
0.6/ 100
METRIC RATING
247th/ 347
METRIC RANK
9.1%
SENIORS POVERTY OVER THE AGE OF 65
99.9/ 100
METRIC RATING
15th/ 347
METRIC RANK
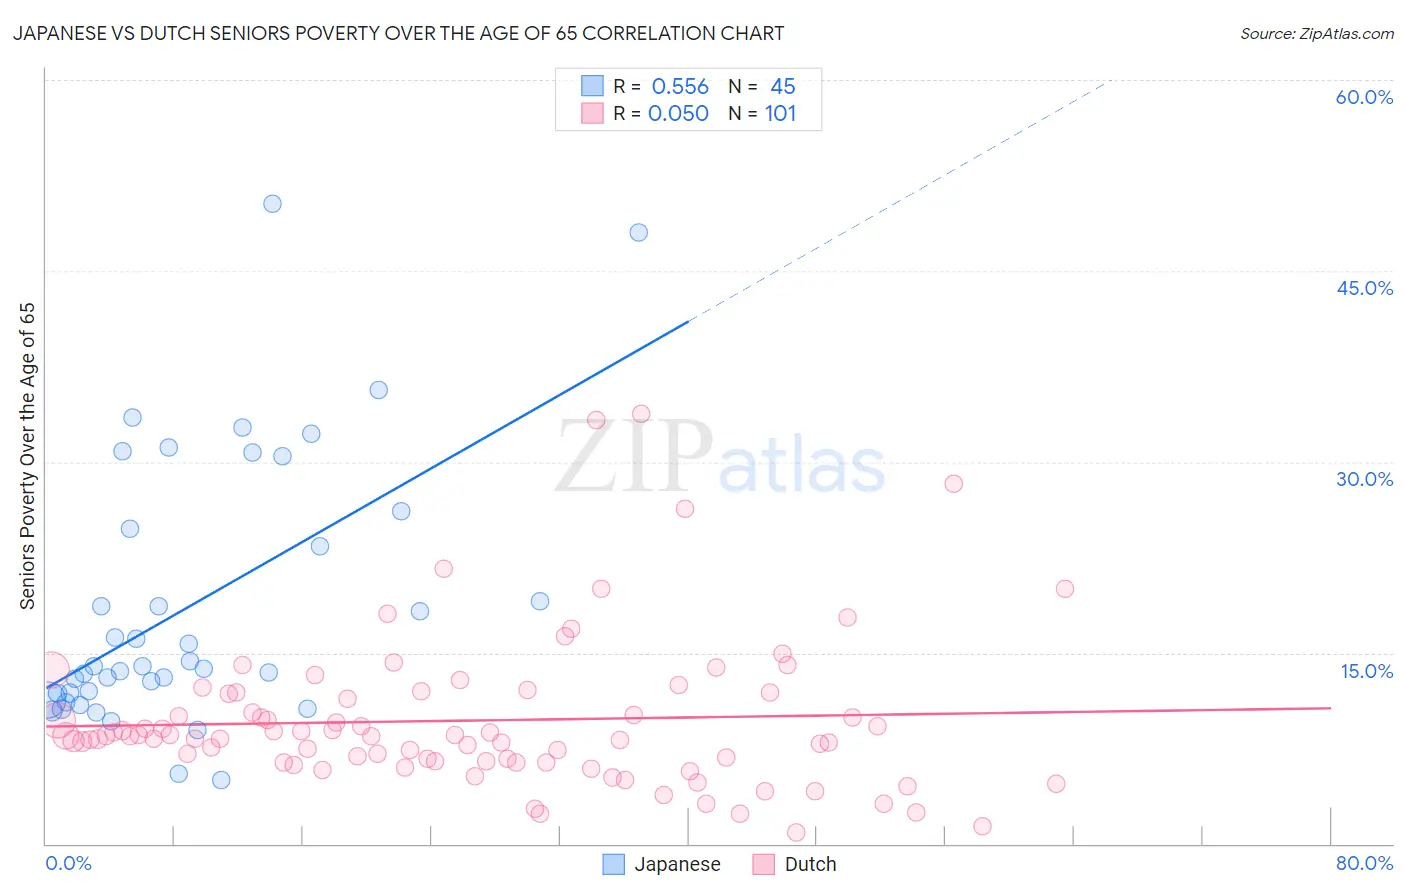
Japanese vs Dutch Seniors Poverty Over the Age of 65 Correlation Chart
The statistical analysis conducted on geographies consisting of 248,625,450 people shows a substantial positive correlation between the proportion of Japanese and poverty level among seniors over the age of 65 in the United States with a correlation coefficient (R) of 0.556 and weighted average of 12.2%. Similarly, the statistical analysis conducted on geographies consisting of 549,604,149 people shows a slight positive correlation between the proportion of Dutch and poverty level among seniors over the age of 65 in the United States with a correlation coefficient (R) of 0.050 and weighted average of 9.1%, a difference of 33.1%.
Seniors Poverty Over the Age of 65 Correlation Summary
| Measurement | Japanese | Dutch |
| Minimum | 5.0% | 0.88% |
| Maximum | 50.3% | 33.8% |
| Range | 45.3% | 32.9% |
| Mean | 18.7% | 9.7% |
| Median | 13.9% | 8.5% |
| Interquartile 25% (IQ1) | 11.5% | 6.4% |
| Interquartile 75% (IQ3) | 25.4% | 11.8% |
| Interquartile Range (IQR) | 13.9% | 5.4% |
| Standard Deviation (Sample) | 10.5% | 5.9% |
| Standard Deviation (Population) | 10.4% | 5.8% |
Similar Demographics by Seniors Poverty Over the Age of 65
Demographics Similar to Japanese by Seniors Poverty Over the Age of 65
In terms of seniors poverty over the age of 65, the demographic groups most similar to Japanese are Spanish American (12.2%, a difference of 0.010%), Ute (12.2%, a difference of 0.060%), Cree (12.1%, a difference of 0.11%), Chippewa (12.1%, a difference of 0.22%), and Immigrants from Portugal (12.1%, a difference of 0.33%).
| Demographics | Rating | Rank | Seniors Poverty Over the Age of 65 |
| Comanche | 0.9 /100 | #240 | Tragic 12.1% |
| Immigrants | Albania | 0.9 /100 | #241 | Tragic 12.1% |
| Sub-Saharan Africans | 0.9 /100 | #242 | Tragic 12.1% |
| Uruguayans | 0.8 /100 | #243 | Tragic 12.1% |
| Immigrants | Portugal | 0.8 /100 | #244 | Tragic 12.1% |
| Chippewa | 0.7 /100 | #245 | Tragic 12.1% |
| Cree | 0.7 /100 | #246 | Tragic 12.1% |
| Japanese | 0.6 /100 | #247 | Tragic 12.2% |
| Spanish Americans | 0.6 /100 | #248 | Tragic 12.2% |
| Ute | 0.6 /100 | #249 | Tragic 12.2% |
| Immigrants | Liberia | 0.5 /100 | #250 | Tragic 12.2% |
| Somalis | 0.3 /100 | #251 | Tragic 12.3% |
| Armenians | 0.3 /100 | #252 | Tragic 12.3% |
| Shoshone | 0.3 /100 | #253 | Tragic 12.3% |
| Immigrants | Cambodia | 0.3 /100 | #254 | Tragic 12.4% |
Demographics Similar to Dutch by Seniors Poverty Over the Age of 65
In terms of seniors poverty over the age of 65, the demographic groups most similar to Dutch are Polish (9.1%, a difference of 0.070%), Croatian (9.1%, a difference of 0.10%), Scandinavian (9.1%, a difference of 0.14%), Maltese (9.1%, a difference of 0.32%), and European (9.2%, a difference of 0.37%).
| Demographics | Rating | Rank | Seniors Poverty Over the Age of 65 |
| Czechs | 100.0 /100 | #8 | Exceptional 9.0% |
| English | 100.0 /100 | #9 | Exceptional 9.1% |
| Lithuanians | 100.0 /100 | #10 | Exceptional 9.1% |
| Maltese | 99.9 /100 | #11 | Exceptional 9.1% |
| Scandinavians | 99.9 /100 | #12 | Exceptional 9.1% |
| Croatians | 99.9 /100 | #13 | Exceptional 9.1% |
| Poles | 99.9 /100 | #14 | Exceptional 9.1% |
| Dutch | 99.9 /100 | #15 | Exceptional 9.1% |
| Europeans | 99.9 /100 | #16 | Exceptional 9.2% |
| Scottish | 99.9 /100 | #17 | Exceptional 9.2% |
| Slovaks | 99.9 /100 | #18 | Exceptional 9.2% |
| Swiss | 99.9 /100 | #19 | Exceptional 9.2% |
| Thais | 99.9 /100 | #20 | Exceptional 9.2% |
| Luxembourgers | 99.9 /100 | #21 | Exceptional 9.2% |
| Slovenes | 99.9 /100 | #22 | Exceptional 9.3% |