Israeli vs Ute Female Poverty Among 25-34 Year Olds
COMPARE
Israeli
Ute
Female Poverty Among 25-34 Year Olds
Female Poverty Among 25-34 Year Olds Comparison
Israelis
Ute
13.1%
FEMALE POVERTY AMONG 25-34 YEAR OLDS
81.9/ 100
METRIC RATING
143rd/ 347
METRIC RANK
17.9%
FEMALE POVERTY AMONG 25-34 YEAR OLDS
0.0/ 100
METRIC RATING
318th/ 347
METRIC RANK
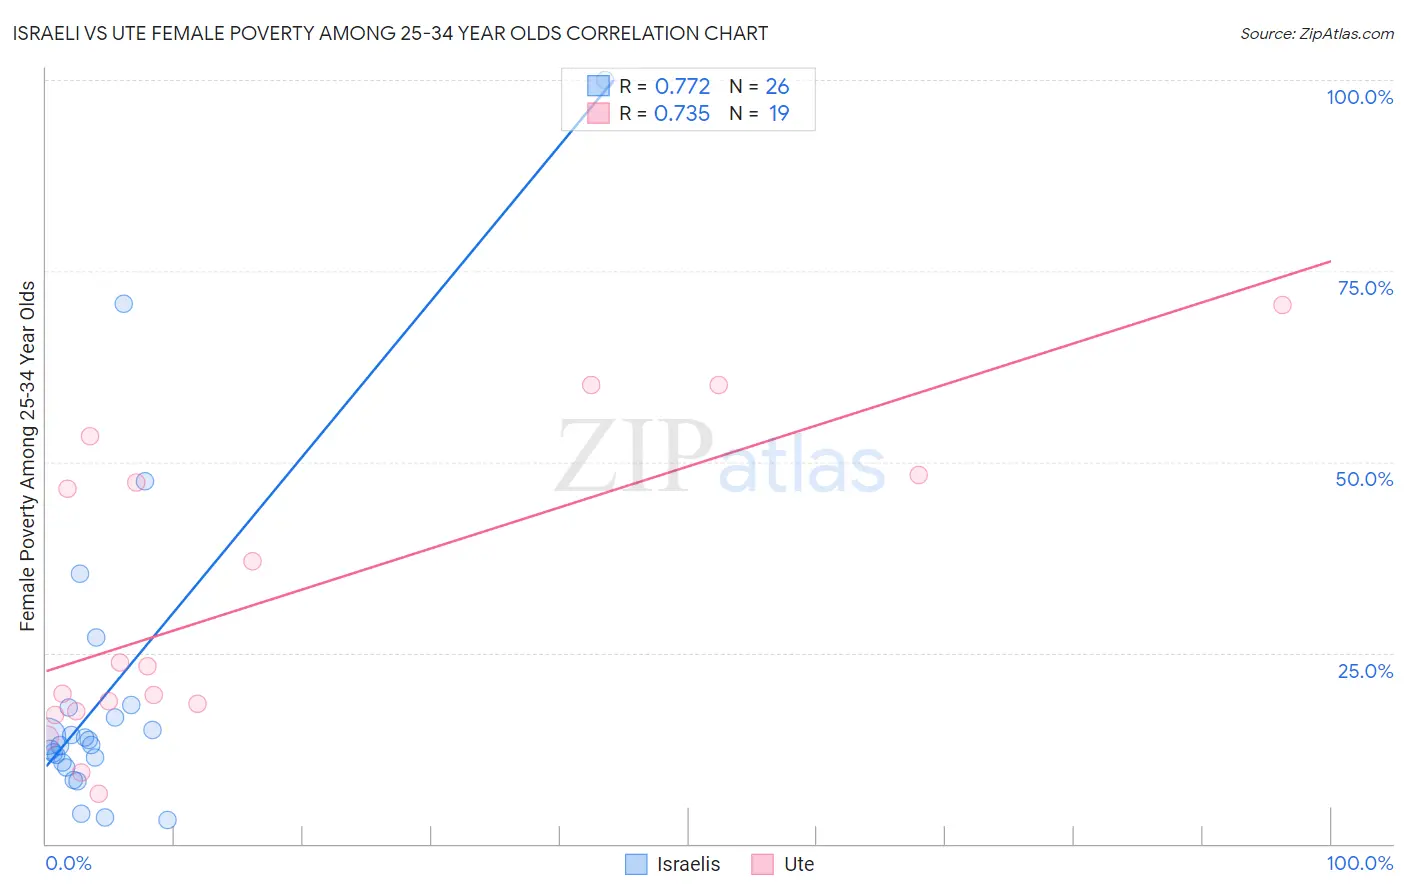
Israeli vs Ute Female Poverty Among 25-34 Year Olds Correlation Chart
The statistical analysis conducted on geographies consisting of 208,501,363 people shows a strong positive correlation between the proportion of Israelis and poverty level among females between the ages 25 and 34 in the United States with a correlation coefficient (R) of 0.772 and weighted average of 13.1%. Similarly, the statistical analysis conducted on geographies consisting of 55,501,714 people shows a strong positive correlation between the proportion of Ute and poverty level among females between the ages 25 and 34 in the United States with a correlation coefficient (R) of 0.735 and weighted average of 17.9%, a difference of 36.3%.
Female Poverty Among 25-34 Year Olds Correlation Summary
| Measurement | Israeli | Ute |
| Minimum | 3.1% | 6.5% |
| Maximum | 100.0% | 70.6% |
| Range | 96.9% | 64.1% |
| Mean | 20.1% | 32.1% |
| Median | 13.3% | 23.3% |
| Interquartile 25% (IQ1) | 10.6% | 17.3% |
| Interquartile 75% (IQ3) | 17.8% | 48.2% |
| Interquartile Range (IQR) | 7.3% | 30.9% |
| Standard Deviation (Sample) | 21.8% | 19.7% |
| Standard Deviation (Population) | 21.4% | 19.2% |
Similar Demographics by Female Poverty Among 25-34 Year Olds
Demographics Similar to Israelis by Female Poverty Among 25-34 Year Olds
In terms of female poverty among 25-34 year olds, the demographic groups most similar to Israelis are Scandinavian (13.1%, a difference of 0.060%), New Zealander (13.1%, a difference of 0.22%), Immigrants from Iraq (13.1%, a difference of 0.26%), Austrian (13.1%, a difference of 0.28%), and Brazilian (13.1%, a difference of 0.40%).
| Demographics | Rating | Rank | Female Poverty Among 25-34 Year Olds |
| Immigrants | England | 85.5 /100 | #136 | Excellent 13.0% |
| Immigrants | Chile | 84.6 /100 | #137 | Excellent 13.1% |
| Brazilians | 84.5 /100 | #138 | Excellent 13.1% |
| Austrians | 83.7 /100 | #139 | Excellent 13.1% |
| Immigrants | Iraq | 83.6 /100 | #140 | Excellent 13.1% |
| New Zealanders | 83.4 /100 | #141 | Excellent 13.1% |
| Scandinavians | 82.3 /100 | #142 | Excellent 13.1% |
| Israelis | 81.9 /100 | #143 | Excellent 13.1% |
| Native Hawaiians | 78.9 /100 | #144 | Good 13.2% |
| Colombians | 77.2 /100 | #145 | Good 13.2% |
| South Americans | 76.9 /100 | #146 | Good 13.2% |
| Europeans | 76.8 /100 | #147 | Good 13.2% |
| Lebanese | 76.8 /100 | #148 | Good 13.2% |
| Sierra Leoneans | 76.3 /100 | #149 | Good 13.2% |
| Iraqis | 76.0 /100 | #150 | Good 13.2% |
Demographics Similar to Ute by Female Poverty Among 25-34 Year Olds
In terms of female poverty among 25-34 year olds, the demographic groups most similar to Ute are Menominee (18.0%, a difference of 0.55%), Arapaho (17.8%, a difference of 0.60%), Chippewa (18.0%, a difference of 0.81%), Choctaw (18.1%, a difference of 1.0%), and Dominican (17.6%, a difference of 1.4%).
| Demographics | Rating | Rank | Female Poverty Among 25-34 Year Olds |
| Immigrants | Honduras | 0.0 /100 | #311 | Tragic 17.3% |
| Iroquois | 0.0 /100 | #312 | Tragic 17.5% |
| Colville | 0.0 /100 | #313 | Tragic 17.5% |
| Immigrants | Dominican Republic | 0.0 /100 | #314 | Tragic 17.6% |
| Yakama | 0.0 /100 | #315 | Tragic 17.6% |
| Dominicans | 0.0 /100 | #316 | Tragic 17.6% |
| Arapaho | 0.0 /100 | #317 | Tragic 17.8% |
| Ute | 0.0 /100 | #318 | Tragic 17.9% |
| Menominee | 0.0 /100 | #319 | Tragic 18.0% |
| Chippewa | 0.0 /100 | #320 | Tragic 18.0% |
| Choctaw | 0.0 /100 | #321 | Tragic 18.1% |
| Central American Indians | 0.0 /100 | #322 | Tragic 18.2% |
| Seminole | 0.0 /100 | #323 | Tragic 18.3% |
| Dutch West Indians | 0.0 /100 | #324 | Tragic 18.4% |
| Inupiat | 0.0 /100 | #325 | Tragic 18.5% |