Israeli vs Ute Currently Married
COMPARE
Israeli
Ute
Currently Married
Currently Married Comparison
Israelis
Ute
46.6%
CURRENTLY MARRIED
48.6/ 100
METRIC RATING
177th/ 347
METRIC RANK
43.9%
CURRENTLY MARRIED
0.2/ 100
METRIC RATING
258th/ 347
METRIC RANK
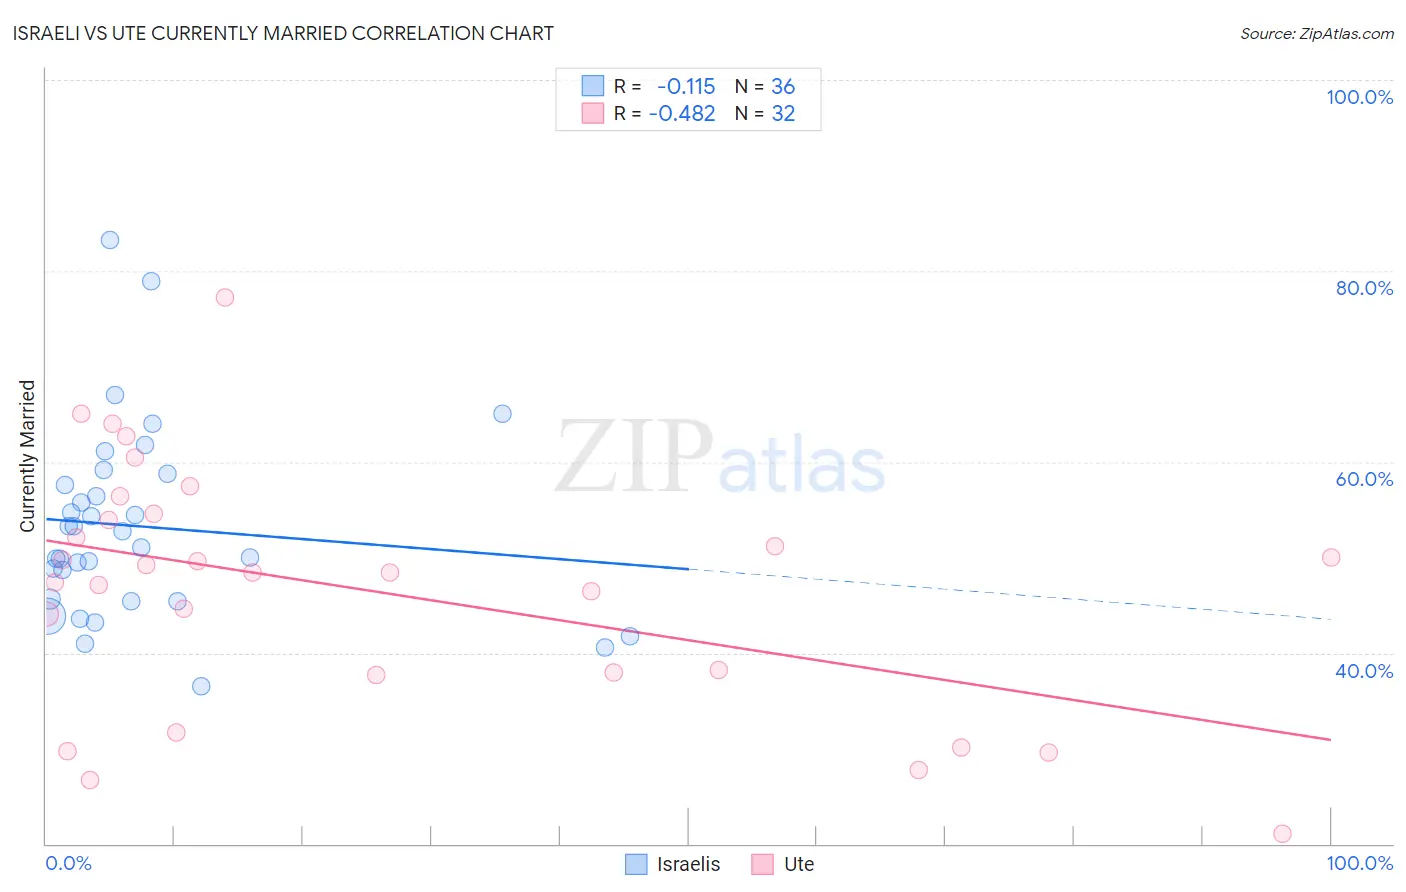
Israeli vs Ute Currently Married Correlation Chart
The statistical analysis conducted on geographies consisting of 211,175,019 people shows a poor negative correlation between the proportion of Israelis and percentage of population currently married in the United States with a correlation coefficient (R) of -0.115 and weighted average of 46.6%. Similarly, the statistical analysis conducted on geographies consisting of 55,668,599 people shows a moderate negative correlation between the proportion of Ute and percentage of population currently married in the United States with a correlation coefficient (R) of -0.482 and weighted average of 43.9%, a difference of 6.2%.
Currently Married Correlation Summary
| Measurement | Israeli | Ute |
| Minimum | 36.5% | 21.0% |
| Maximum | 83.2% | 77.2% |
| Range | 46.7% | 56.2% |
| Mean | 53.2% | 46.6% |
| Median | 51.9% | 48.4% |
| Interquartile 25% (IQ1) | 45.5% | 37.9% |
| Interquartile 75% (IQ3) | 58.2% | 54.2% |
| Interquartile Range (IQR) | 12.6% | 16.4% |
| Standard Deviation (Sample) | 10.0% | 12.9% |
| Standard Deviation (Population) | 9.9% | 12.7% |
Similar Demographics by Currently Married
Demographics Similar to Israelis by Currently Married
In terms of currently married, the demographic groups most similar to Israelis are Hawaiian (46.6%, a difference of 0.0%), Chickasaw (46.6%, a difference of 0.030%), Peruvian (46.6%, a difference of 0.050%), Immigrants from Brazil (46.6%, a difference of 0.050%), and Tlingit-Haida (46.7%, a difference of 0.10%).
| Demographics | Rating | Rank | Currently Married |
| Immigrants | Latvia | 56.7 /100 | #170 | Average 46.7% |
| Immigrants | Zimbabwe | 52.4 /100 | #171 | Average 46.7% |
| Aleuts | 52.0 /100 | #172 | Average 46.7% |
| Tlingit-Haida | 51.2 /100 | #173 | Average 46.7% |
| Peruvians | 50.0 /100 | #174 | Average 46.6% |
| Immigrants | Brazil | 49.9 /100 | #175 | Average 46.6% |
| Hawaiians | 48.6 /100 | #176 | Average 46.6% |
| Israelis | 48.6 /100 | #177 | Average 46.6% |
| Chickasaw | 47.8 /100 | #178 | Average 46.6% |
| Immigrants | Oceania | 44.6 /100 | #179 | Average 46.5% |
| Costa Ricans | 43.7 /100 | #180 | Average 46.5% |
| Ottawa | 43.0 /100 | #181 | Average 46.5% |
| Potawatomi | 41.9 /100 | #182 | Average 46.5% |
| Immigrants | Northern Africa | 39.7 /100 | #183 | Fair 46.5% |
| Brazilians | 39.3 /100 | #184 | Fair 46.4% |
Demographics Similar to Ute by Currently Married
In terms of currently married, the demographic groups most similar to Ute are Immigrants from Africa (43.9%, a difference of 0.010%), Shoshone (44.0%, a difference of 0.21%), Immigrants from Sierra Leone (43.8%, a difference of 0.21%), Yakama (44.0%, a difference of 0.26%), and Immigrants from Latin America (43.8%, a difference of 0.27%).
| Demographics | Rating | Rank | Currently Married |
| Blackfeet | 0.3 /100 | #251 | Tragic 44.2% |
| Hispanics or Latinos | 0.3 /100 | #252 | Tragic 44.1% |
| Immigrants | Central America | 0.3 /100 | #253 | Tragic 44.1% |
| Vietnamese | 0.2 /100 | #254 | Tragic 44.0% |
| Yakama | 0.2 /100 | #255 | Tragic 44.0% |
| Shoshone | 0.2 /100 | #256 | Tragic 44.0% |
| Immigrants | Africa | 0.2 /100 | #257 | Tragic 43.9% |
| Ute | 0.2 /100 | #258 | Tragic 43.9% |
| Immigrants | Sierra Leone | 0.1 /100 | #259 | Tragic 43.8% |
| Immigrants | Latin America | 0.1 /100 | #260 | Tragic 43.8% |
| Immigrants | Nicaragua | 0.1 /100 | #261 | Tragic 43.7% |
| Bangladeshis | 0.1 /100 | #262 | Tragic 43.7% |
| Immigrants | Cuba | 0.1 /100 | #263 | Tragic 43.7% |
| Sudanese | 0.1 /100 | #264 | Tragic 43.7% |
| Immigrants | Bangladesh | 0.1 /100 | #265 | Tragic 43.6% |