Israeli vs Salvadoran Female Poverty
COMPARE
Israeli
Salvadoran
Female Poverty
Female Poverty Comparison
Israelis
Salvadorans
13.5%
FEMALE POVERTY
49.1/ 100
METRIC RATING
178th/ 347
METRIC RANK
15.3%
FEMALE POVERTY
0.3/ 100
METRIC RATING
249th/ 347
METRIC RANK
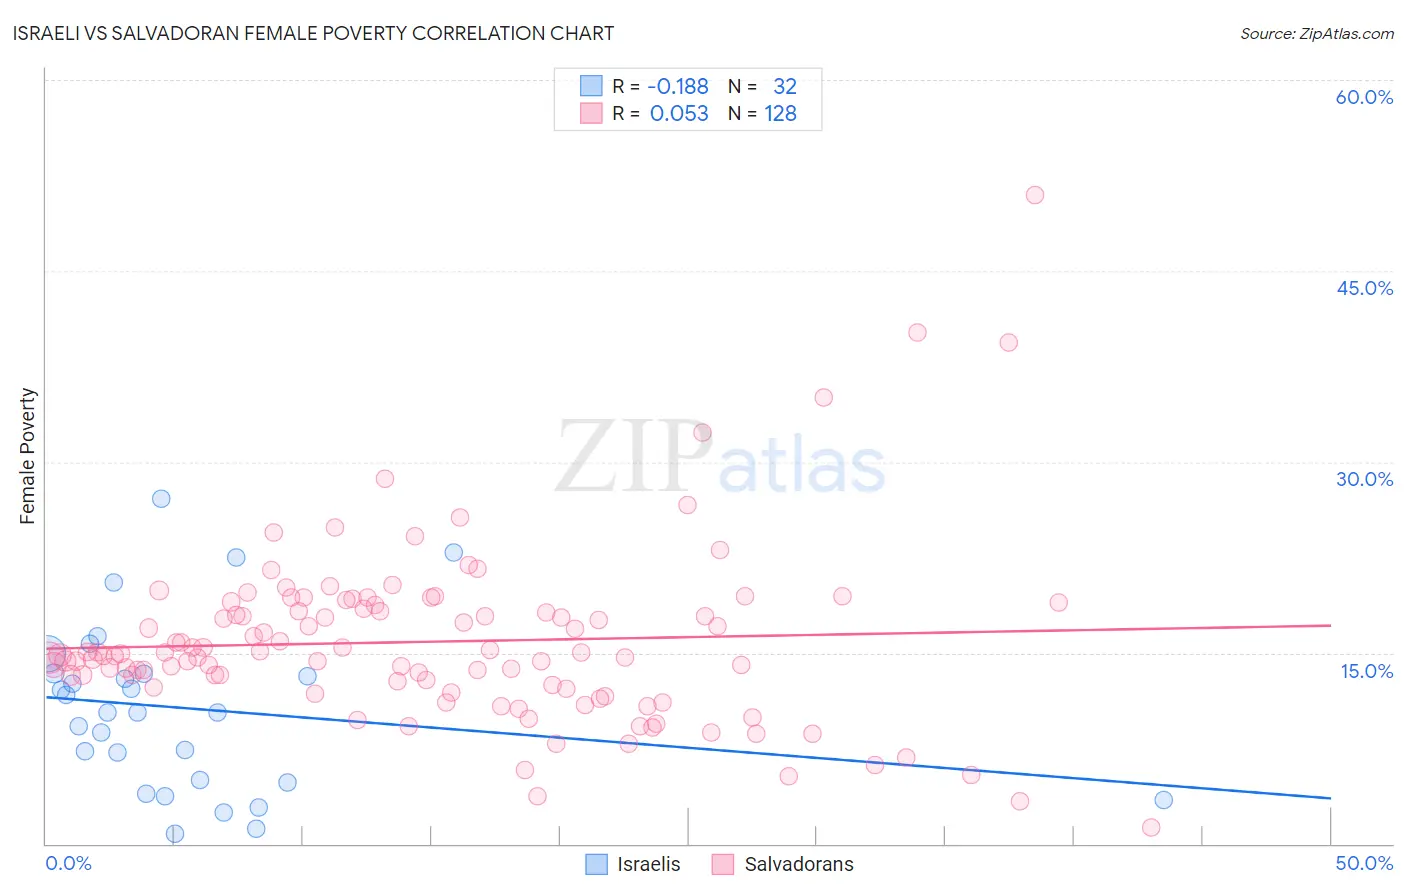
Israeli vs Salvadoran Female Poverty Correlation Chart
The statistical analysis conducted on geographies consisting of 211,005,124 people shows a poor negative correlation between the proportion of Israelis and poverty level among females in the United States with a correlation coefficient (R) of -0.188 and weighted average of 13.5%. Similarly, the statistical analysis conducted on geographies consisting of 398,655,447 people shows a slight positive correlation between the proportion of Salvadorans and poverty level among females in the United States with a correlation coefficient (R) of 0.053 and weighted average of 15.3%, a difference of 13.9%.
Female Poverty Correlation Summary
| Measurement | Israeli | Salvadoran |
| Minimum | 0.76% | 1.3% |
| Maximum | 27.1% | 50.9% |
| Range | 26.4% | 49.7% |
| Mean | 10.6% | 15.9% |
| Median | 10.3% | 14.9% |
| Interquartile 25% (IQ1) | 4.9% | 12.3% |
| Interquartile 75% (IQ3) | 13.4% | 18.6% |
| Interquartile Range (IQR) | 8.5% | 6.3% |
| Standard Deviation (Sample) | 6.6% | 6.9% |
| Standard Deviation (Population) | 6.5% | 6.9% |
Similar Demographics by Female Poverty
Demographics Similar to Israelis by Female Poverty
In terms of female poverty, the demographic groups most similar to Israelis are Immigrants from Morocco (13.4%, a difference of 0.030%), Immigrants from Syria (13.5%, a difference of 0.030%), Celtic (13.4%, a difference of 0.080%), Immigrants from Spain (13.4%, a difference of 0.080%), and Immigrants from Iraq (13.4%, a difference of 0.090%).
| Demographics | Rating | Rank | Female Poverty |
| Whites/Caucasians | 54.6 /100 | #171 | Average 13.4% |
| Mongolians | 53.6 /100 | #172 | Average 13.4% |
| Immigrants | Afghanistan | 50.8 /100 | #173 | Average 13.4% |
| Immigrants | Iraq | 50.0 /100 | #174 | Average 13.4% |
| Celtics | 49.9 /100 | #175 | Average 13.4% |
| Immigrants | Spain | 49.9 /100 | #176 | Average 13.4% |
| Immigrants | Morocco | 49.4 /100 | #177 | Average 13.4% |
| Israelis | 49.1 /100 | #178 | Average 13.5% |
| Immigrants | Syria | 48.8 /100 | #179 | Average 13.5% |
| South Americans | 44.8 /100 | #180 | Average 13.5% |
| Venezuelans | 44.5 /100 | #181 | Average 13.5% |
| Immigrants | Colombia | 44.5 /100 | #182 | Average 13.5% |
| Kenyans | 43.8 /100 | #183 | Average 13.5% |
| Immigrants | Sierra Leone | 43.2 /100 | #184 | Average 13.5% |
| Immigrants | Cameroon | 42.0 /100 | #185 | Average 13.5% |
Demographics Similar to Salvadorans by Female Poverty
In terms of female poverty, the demographic groups most similar to Salvadorans are Immigrants from Western Africa (15.3%, a difference of 0.040%), Potawatomi (15.3%, a difference of 0.14%), Immigrants from Ghana (15.3%, a difference of 0.14%), Cuban (15.3%, a difference of 0.15%), and Spanish American Indian (15.3%, a difference of 0.20%).
| Demographics | Rating | Rank | Female Poverty |
| Nepalese | 0.4 /100 | #242 | Tragic 15.2% |
| Nicaraguans | 0.3 /100 | #243 | Tragic 15.3% |
| Ecuadorians | 0.3 /100 | #244 | Tragic 15.3% |
| Spanish American Indians | 0.3 /100 | #245 | Tragic 15.3% |
| Cubans | 0.3 /100 | #246 | Tragic 15.3% |
| Potawatomi | 0.3 /100 | #247 | Tragic 15.3% |
| Immigrants | Ghana | 0.3 /100 | #248 | Tragic 15.3% |
| Salvadorans | 0.3 /100 | #249 | Tragic 15.3% |
| Immigrants | Western Africa | 0.3 /100 | #250 | Tragic 15.3% |
| Immigrants | Trinidad and Tobago | 0.3 /100 | #251 | Tragic 15.4% |
| Immigrants | Burma/Myanmar | 0.3 /100 | #252 | Tragic 15.4% |
| Liberians | 0.2 /100 | #253 | Tragic 15.4% |
| Trinidadians and Tobagonians | 0.2 /100 | #254 | Tragic 15.4% |
| Ottawa | 0.2 /100 | #255 | Tragic 15.5% |
| Jamaicans | 0.2 /100 | #256 | Tragic 15.5% |