Burmese vs Slovene Single Mother Poverty
COMPARE
Burmese
Slovene
Single Mother Poverty
Single Mother Poverty Comparison
Burmese
Slovenes
26.2%
SINGLE MOTHER POVERTY
100.0/ 100
METRIC RATING
23rd/ 347
METRIC RANK
28.8%
SINGLE MOTHER POVERTY
76.4/ 100
METRIC RATING
153rd/ 347
METRIC RANK
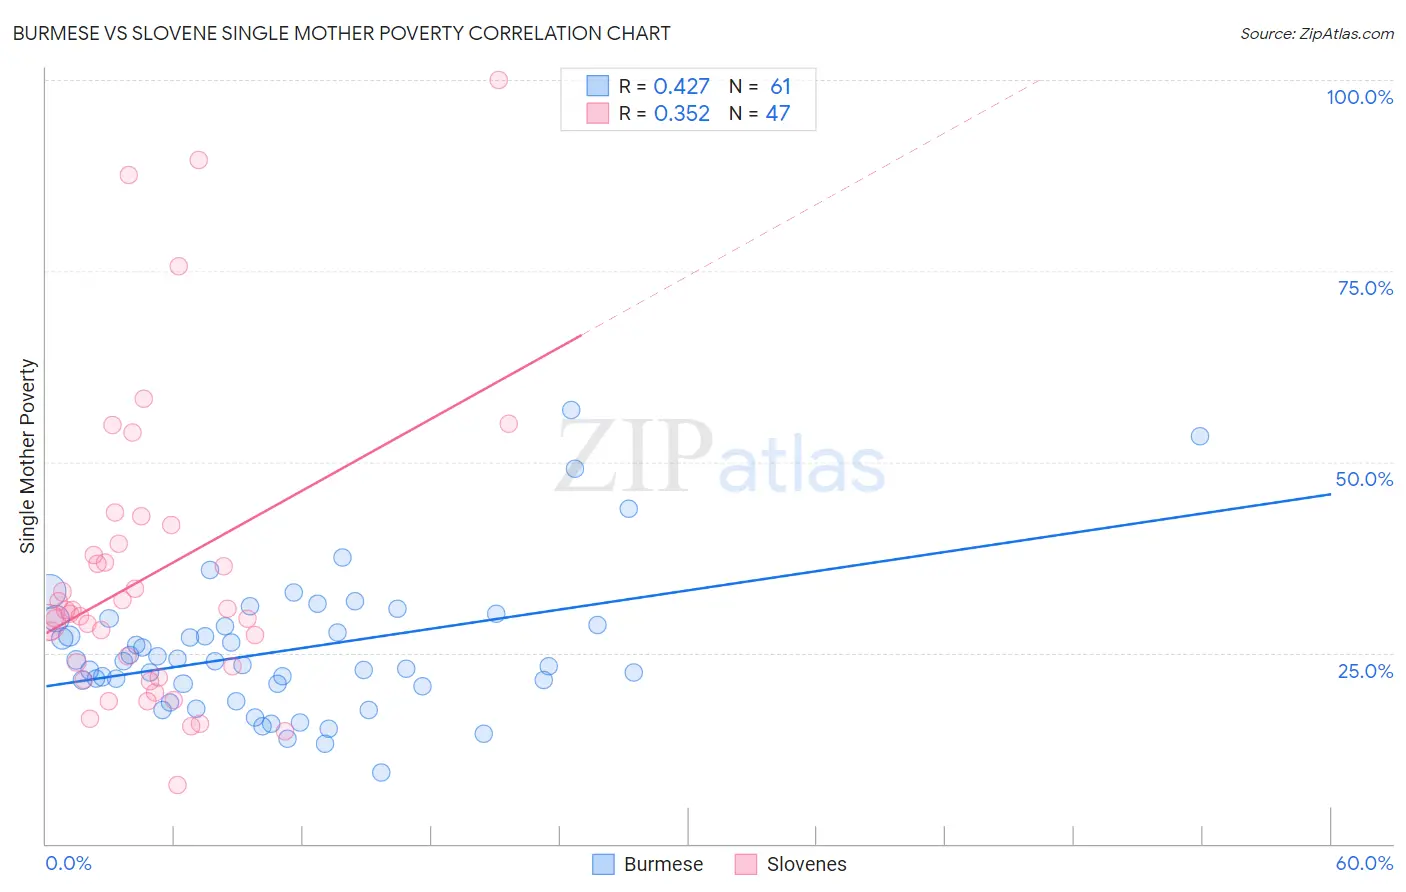
Burmese vs Slovene Single Mother Poverty Correlation Chart
The statistical analysis conducted on geographies consisting of 450,482,396 people shows a moderate positive correlation between the proportion of Burmese and poverty level among single mothers in the United States with a correlation coefficient (R) of 0.427 and weighted average of 26.2%. Similarly, the statistical analysis conducted on geographies consisting of 255,975,131 people shows a mild positive correlation between the proportion of Slovenes and poverty level among single mothers in the United States with a correlation coefficient (R) of 0.352 and weighted average of 28.8%, a difference of 9.6%.
Single Mother Poverty Correlation Summary
| Measurement | Burmese | Slovene |
| Minimum | 9.3% | 7.7% |
| Maximum | 56.9% | 100.0% |
| Range | 47.5% | 92.3% |
| Mean | 25.3% | 35.2% |
| Median | 23.9% | 30.1% |
| Interquartile 25% (IQ1) | 20.8% | 21.7% |
| Interquartile 75% (IQ3) | 29.0% | 39.2% |
| Interquartile Range (IQR) | 8.3% | 17.5% |
| Standard Deviation (Sample) | 9.0% | 19.9% |
| Standard Deviation (Population) | 9.0% | 19.6% |
Similar Demographics by Single Mother Poverty
Demographics Similar to Burmese by Single Mother Poverty
In terms of single mother poverty, the demographic groups most similar to Burmese are Immigrants from Moldova (26.2%, a difference of 0.020%), Immigrants from Korea (26.2%, a difference of 0.17%), Immigrants from Asia (26.3%, a difference of 0.22%), Immigrants from Bolivia (26.2%, a difference of 0.35%), and Immigrants from Sri Lanka (26.3%, a difference of 0.35%).
| Demographics | Rating | Rank | Single Mother Poverty |
| Bolivians | 100.0 /100 | #16 | Exceptional 25.9% |
| Asians | 100.0 /100 | #17 | Exceptional 26.0% |
| Immigrants | Pakistan | 100.0 /100 | #18 | Exceptional 26.0% |
| Immigrants | Eastern Asia | 100.0 /100 | #19 | Exceptional 26.1% |
| Immigrants | China | 100.0 /100 | #20 | Exceptional 26.1% |
| Immigrants | Bolivia | 100.0 /100 | #21 | Exceptional 26.2% |
| Immigrants | Korea | 100.0 /100 | #22 | Exceptional 26.2% |
| Burmese | 100.0 /100 | #23 | Exceptional 26.2% |
| Immigrants | Moldova | 100.0 /100 | #24 | Exceptional 26.2% |
| Immigrants | Asia | 100.0 /100 | #25 | Exceptional 26.3% |
| Immigrants | Sri Lanka | 100.0 /100 | #26 | Exceptional 26.3% |
| Immigrants | Japan | 100.0 /100 | #27 | Exceptional 26.4% |
| Koreans | 100.0 /100 | #28 | Exceptional 26.4% |
| Jordanians | 100.0 /100 | #29 | Exceptional 26.4% |
| Turks | 100.0 /100 | #30 | Exceptional 26.4% |
Demographics Similar to Slovenes by Single Mother Poverty
In terms of single mother poverty, the demographic groups most similar to Slovenes are Austrian (28.7%, a difference of 0.18%), Portuguese (28.8%, a difference of 0.21%), Immigrants from Oceania (28.7%, a difference of 0.25%), Ugandan (28.8%, a difference of 0.29%), and Iraqi (28.8%, a difference of 0.31%).
| Demographics | Rating | Rank | Single Mother Poverty |
| Immigrants | Denmark | 86.1 /100 | #146 | Excellent 28.5% |
| Immigrants | Lebanon | 85.3 /100 | #147 | Excellent 28.6% |
| Syrians | 85.3 /100 | #148 | Excellent 28.6% |
| Serbians | 85.0 /100 | #149 | Excellent 28.6% |
| Northern Europeans | 81.7 /100 | #150 | Excellent 28.6% |
| Immigrants | Oceania | 79.9 /100 | #151 | Good 28.7% |
| Austrians | 79.0 /100 | #152 | Good 28.7% |
| Slovenes | 76.4 /100 | #153 | Good 28.8% |
| Portuguese | 73.2 /100 | #154 | Good 28.8% |
| Ugandans | 71.7 /100 | #155 | Good 28.8% |
| Iraqis | 71.5 /100 | #156 | Good 28.8% |
| Immigrants | Western Europe | 71.1 /100 | #157 | Good 28.9% |
| Immigrants | Hungary | 70.6 /100 | #158 | Good 28.9% |
| Czechs | 68.4 /100 | #159 | Good 28.9% |
| Japanese | 68.0 /100 | #160 | Good 28.9% |