Immigrants from Latin America vs Slovene Single Mother Poverty
COMPARE
Immigrants from Latin America
Slovene
Single Mother Poverty
Single Mother Poverty Comparison
Immigrants from Latin America
Slovenes
32.4%
SINGLE MOTHER POVERTY
0.0/ 100
METRIC RATING
285th/ 347
METRIC RANK
28.8%
SINGLE MOTHER POVERTY
76.4/ 100
METRIC RATING
153rd/ 347
METRIC RANK
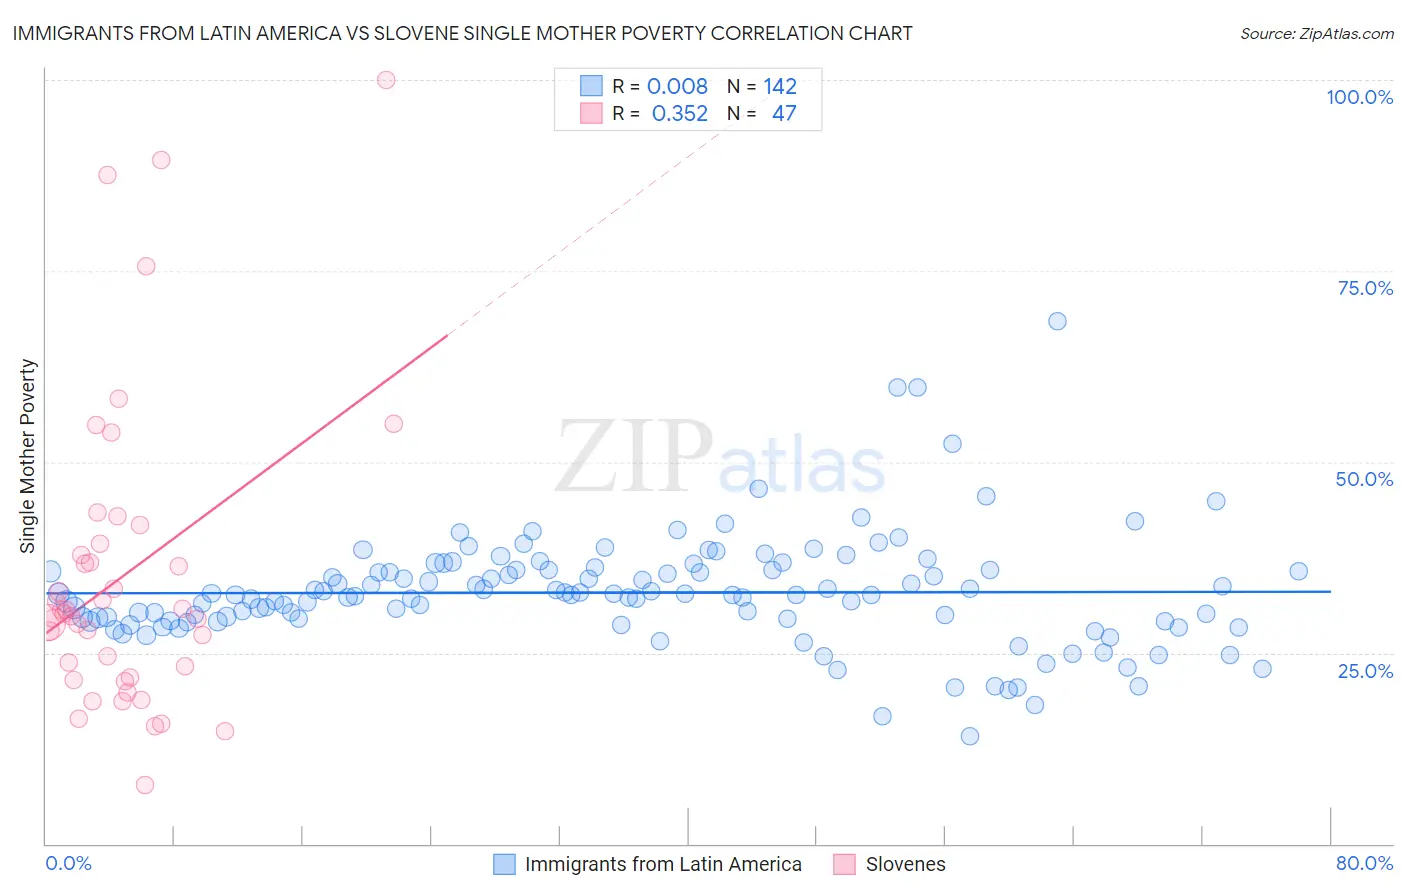
Immigrants from Latin America vs Slovene Single Mother Poverty Correlation Chart
The statistical analysis conducted on geographies consisting of 534,740,135 people shows no correlation between the proportion of Immigrants from Latin America and poverty level among single mothers in the United States with a correlation coefficient (R) of 0.008 and weighted average of 32.4%. Similarly, the statistical analysis conducted on geographies consisting of 255,975,131 people shows a mild positive correlation between the proportion of Slovenes and poverty level among single mothers in the United States with a correlation coefficient (R) of 0.352 and weighted average of 28.8%, a difference of 12.8%.
Single Mother Poverty Correlation Summary
| Measurement | Immigrants from Latin America | Slovene |
| Minimum | 14.1% | 7.7% |
| Maximum | 68.5% | 100.0% |
| Range | 54.3% | 92.3% |
| Mean | 32.9% | 35.2% |
| Median | 32.6% | 30.1% |
| Interquartile 25% (IQ1) | 29.2% | 21.7% |
| Interquartile 75% (IQ3) | 35.8% | 39.2% |
| Interquartile Range (IQR) | 6.6% | 17.5% |
| Standard Deviation (Sample) | 7.3% | 19.9% |
| Standard Deviation (Population) | 7.3% | 19.6% |
Similar Demographics by Single Mother Poverty
Demographics Similar to Immigrants from Latin America by Single Mother Poverty
In terms of single mother poverty, the demographic groups most similar to Immigrants from Latin America are Yup'ik (32.5%, a difference of 0.070%), Indonesian (32.4%, a difference of 0.11%), Immigrants from Dominica (32.5%, a difference of 0.20%), Spanish American (32.3%, a difference of 0.41%), and Somali (32.6%, a difference of 0.43%).
| Demographics | Rating | Rank | Single Mother Poverty |
| Immigrants | Zaire | 0.0 /100 | #278 | Tragic 32.0% |
| Marshallese | 0.0 /100 | #279 | Tragic 32.1% |
| Immigrants | Nonimmigrants | 0.0 /100 | #280 | Tragic 32.2% |
| Cree | 0.0 /100 | #281 | Tragic 32.2% |
| Immigrants | Azores | 0.0 /100 | #282 | Tragic 32.2% |
| Spanish Americans | 0.0 /100 | #283 | Tragic 32.3% |
| Indonesians | 0.0 /100 | #284 | Tragic 32.4% |
| Immigrants | Latin America | 0.0 /100 | #285 | Tragic 32.4% |
| Yup'ik | 0.0 /100 | #286 | Tragic 32.5% |
| Immigrants | Dominica | 0.0 /100 | #287 | Tragic 32.5% |
| Somalis | 0.0 /100 | #288 | Tragic 32.6% |
| U.S. Virgin Islanders | 0.0 /100 | #289 | Tragic 32.6% |
| Osage | 0.0 /100 | #290 | Tragic 32.6% |
| Guatemalans | 0.0 /100 | #291 | Tragic 32.9% |
| Shoshone | 0.0 /100 | #292 | Tragic 32.9% |
Demographics Similar to Slovenes by Single Mother Poverty
In terms of single mother poverty, the demographic groups most similar to Slovenes are Austrian (28.7%, a difference of 0.18%), Portuguese (28.8%, a difference of 0.21%), Immigrants from Oceania (28.7%, a difference of 0.25%), Ugandan (28.8%, a difference of 0.29%), and Iraqi (28.8%, a difference of 0.31%).
| Demographics | Rating | Rank | Single Mother Poverty |
| Immigrants | Denmark | 86.1 /100 | #146 | Excellent 28.5% |
| Immigrants | Lebanon | 85.3 /100 | #147 | Excellent 28.6% |
| Syrians | 85.3 /100 | #148 | Excellent 28.6% |
| Serbians | 85.0 /100 | #149 | Excellent 28.6% |
| Northern Europeans | 81.7 /100 | #150 | Excellent 28.6% |
| Immigrants | Oceania | 79.9 /100 | #151 | Good 28.7% |
| Austrians | 79.0 /100 | #152 | Good 28.7% |
| Slovenes | 76.4 /100 | #153 | Good 28.8% |
| Portuguese | 73.2 /100 | #154 | Good 28.8% |
| Ugandans | 71.7 /100 | #155 | Good 28.8% |
| Iraqis | 71.5 /100 | #156 | Good 28.8% |
| Immigrants | Western Europe | 71.1 /100 | #157 | Good 28.9% |
| Immigrants | Hungary | 70.6 /100 | #158 | Good 28.9% |
| Czechs | 68.4 /100 | #159 | Good 28.9% |
| Japanese | 68.0 /100 | #160 | Good 28.9% |