Iroquois vs Immigrants from Thailand Associate's Degree
COMPARE
Iroquois
Immigrants from Thailand
Associate's Degree
Associate's Degree Comparison
Iroquois
Immigrants from Thailand
42.8%
ASSOCIATE'S DEGREE
1.7/ 100
METRIC RATING
238th/ 347
METRIC RANK
45.1%
ASSOCIATE'S DEGREE
18.9/ 100
METRIC RATING
205th/ 347
METRIC RANK
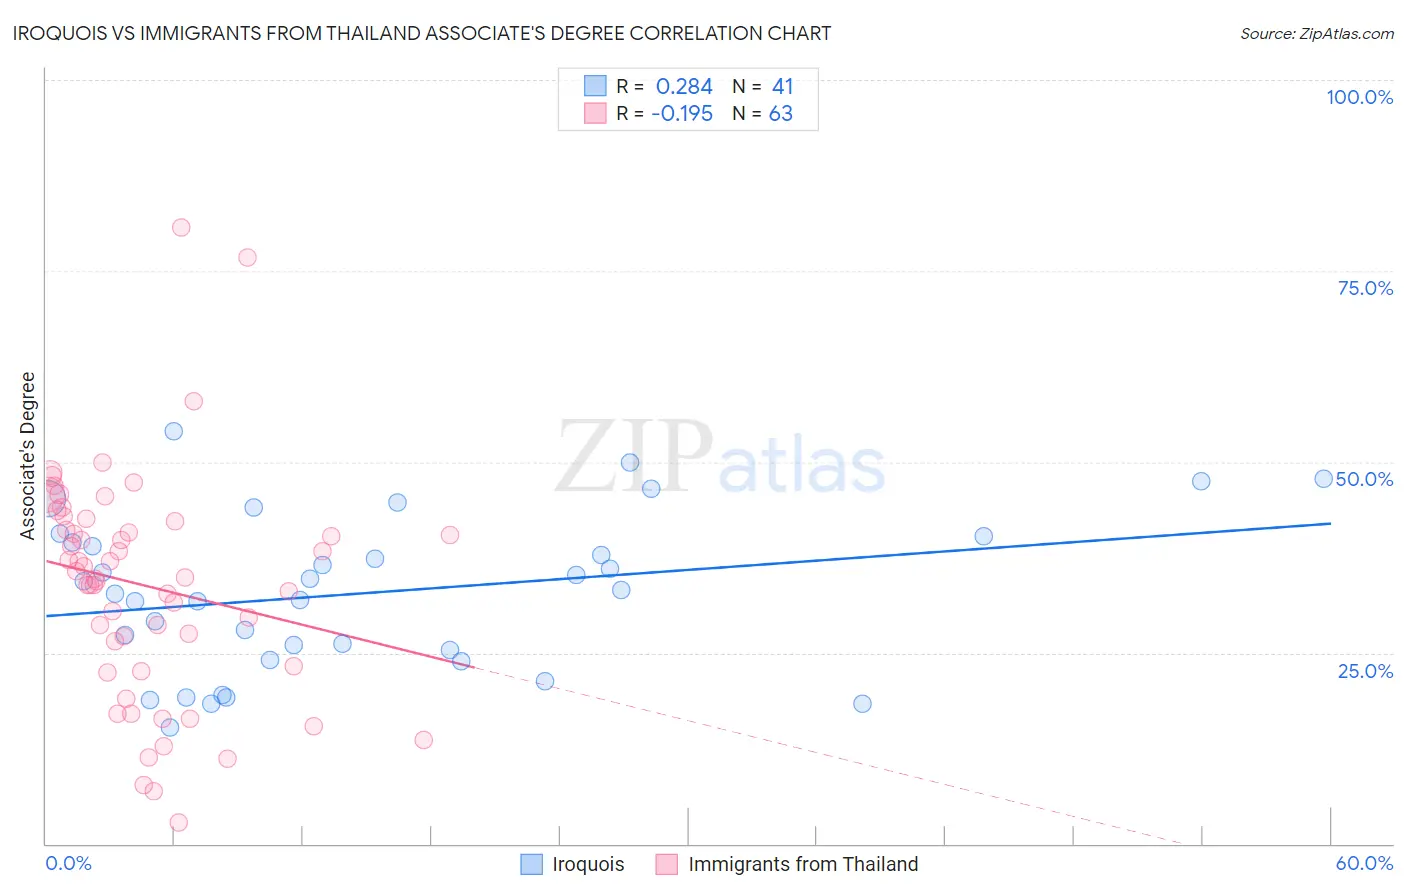
Iroquois vs Immigrants from Thailand Associate's Degree Correlation Chart
The statistical analysis conducted on geographies consisting of 207,308,228 people shows a weak positive correlation between the proportion of Iroquois and percentage of population with at least associate's degree education in the United States with a correlation coefficient (R) of 0.284 and weighted average of 42.8%. Similarly, the statistical analysis conducted on geographies consisting of 317,008,918 people shows a poor negative correlation between the proportion of Immigrants from Thailand and percentage of population with at least associate's degree education in the United States with a correlation coefficient (R) of -0.195 and weighted average of 45.1%, a difference of 5.3%.
Associate's Degree Correlation Summary
| Measurement | Iroquois | Immigrants from Thailand |
| Minimum | 15.2% | 2.7% |
| Maximum | 54.0% | 80.6% |
| Range | 38.7% | 77.9% |
| Mean | 32.9% | 33.8% |
| Median | 33.2% | 34.9% |
| Interquartile 25% (IQ1) | 24.8% | 23.3% |
| Interquartile 75% (IQ3) | 39.9% | 42.3% |
| Interquartile Range (IQR) | 15.1% | 19.0% |
| Standard Deviation (Sample) | 10.1% | 14.7% |
| Standard Deviation (Population) | 9.9% | 14.6% |
Similar Demographics by Associate's Degree
Demographics Similar to Iroquois by Associate's Degree
In terms of associate's degree, the demographic groups most similar to Iroquois are Nonimmigrants (42.9%, a difference of 0.26%), Immigrants from St. Vincent and the Grenadines (42.9%, a difference of 0.28%), Ecuadorian (43.0%, a difference of 0.36%), Tlingit-Haida (43.0%, a difference of 0.45%), and Immigrants from Grenada (42.6%, a difference of 0.51%).
| Demographics | Rating | Rank | Associate's Degree |
| Liberians | 2.9 /100 | #231 | Tragic 43.3% |
| Native Hawaiians | 2.3 /100 | #232 | Tragic 43.1% |
| Tongans | 2.2 /100 | #233 | Tragic 43.0% |
| Tlingit-Haida | 2.1 /100 | #234 | Tragic 43.0% |
| Ecuadorians | 2.0 /100 | #235 | Tragic 43.0% |
| Immigrants | St. Vincent and the Grenadines | 1.9 /100 | #236 | Tragic 42.9% |
| Immigrants | Nonimmigrants | 1.9 /100 | #237 | Tragic 42.9% |
| Iroquois | 1.7 /100 | #238 | Tragic 42.8% |
| Immigrants | Grenada | 1.3 /100 | #239 | Tragic 42.6% |
| Cree | 1.2 /100 | #240 | Tragic 42.5% |
| British West Indians | 1.0 /100 | #241 | Tragic 42.4% |
| Immigrants | West Indies | 1.0 /100 | #242 | Tragic 42.4% |
| Guyanese | 1.0 /100 | #243 | Tragic 42.3% |
| Immigrants | Liberia | 0.9 /100 | #244 | Tragic 42.3% |
| Immigrants | Cambodia | 0.9 /100 | #245 | Tragic 42.3% |
Demographics Similar to Immigrants from Thailand by Associate's Degree
In terms of associate's degree, the demographic groups most similar to Immigrants from Thailand are German Russian (45.1%, a difference of 0.0%), Nigerian (45.1%, a difference of 0.020%), Panamanian (45.1%, a difference of 0.070%), Immigrants from South Eastern Asia (45.2%, a difference of 0.16%), and Dutch (45.0%, a difference of 0.17%).
| Demographics | Rating | Rank | Associate's Degree |
| Immigrants | Bangladesh | 21.3 /100 | #198 | Fair 45.2% |
| Immigrants | Senegal | 21.2 /100 | #199 | Fair 45.2% |
| Senegalese | 21.1 /100 | #200 | Fair 45.2% |
| Immigrants | Vietnam | 20.8 /100 | #201 | Fair 45.2% |
| Spaniards | 20.4 /100 | #202 | Fair 45.2% |
| Immigrants | South Eastern Asia | 20.2 /100 | #203 | Fair 45.2% |
| Nigerians | 19.1 /100 | #204 | Poor 45.1% |
| Immigrants | Thailand | 18.9 /100 | #205 | Poor 45.1% |
| German Russians | 18.9 /100 | #206 | Poor 45.1% |
| Panamanians | 18.4 /100 | #207 | Poor 45.1% |
| Dutch | 17.6 /100 | #208 | Poor 45.0% |
| Immigrants | Costa Rica | 16.7 /100 | #209 | Poor 45.0% |
| Immigrants | Philippines | 16.7 /100 | #210 | Poor 45.0% |
| Immigrants | Zaire | 16.6 /100 | #211 | Poor 45.0% |
| French Canadians | 15.0 /100 | #212 | Poor 44.9% |