Iroquois vs Immigrants from Thailand Single Father Households
COMPARE
Iroquois
Immigrants from Thailand
Single Father Households
Single Father Households Comparison
Iroquois
Immigrants from Thailand
2.6%
SINGLE FATHER HOUSEHOLDS
0.2/ 100
METRIC RATING
273rd/ 347
METRIC RANK
2.5%
SINGLE FATHER HOUSEHOLDS
1.8/ 100
METRIC RATING
254th/ 347
METRIC RANK
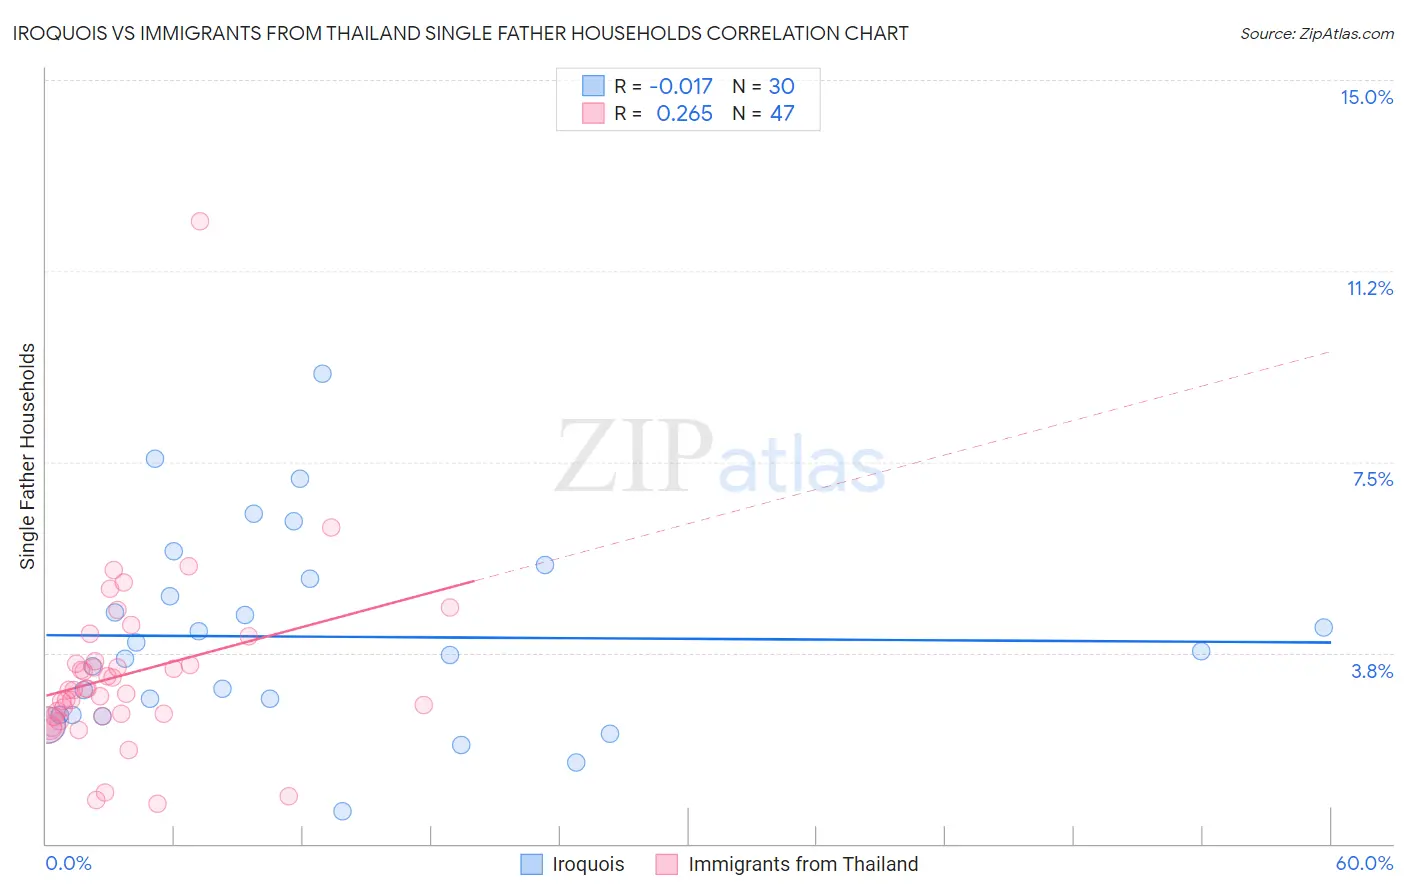
Iroquois vs Immigrants from Thailand Single Father Households Correlation Chart
The statistical analysis conducted on geographies consisting of 206,362,821 people shows no correlation between the proportion of Iroquois and percentage of single father households in the United States with a correlation coefficient (R) of -0.017 and weighted average of 2.6%. Similarly, the statistical analysis conducted on geographies consisting of 315,341,972 people shows a weak positive correlation between the proportion of Immigrants from Thailand and percentage of single father households in the United States with a correlation coefficient (R) of 0.265 and weighted average of 2.5%, a difference of 3.8%.
Single Father Households Correlation Summary
| Measurement | Iroquois | Immigrants from Thailand |
| Minimum | 0.63% | 0.78% |
| Maximum | 9.2% | 12.2% |
| Range | 8.6% | 11.5% |
| Mean | 4.1% | 3.3% |
| Median | 3.7% | 3.0% |
| Interquartile 25% (IQ1) | 2.5% | 2.5% |
| Interquartile 75% (IQ3) | 5.2% | 3.6% |
| Interquartile Range (IQR) | 2.7% | 1.1% |
| Standard Deviation (Sample) | 1.9% | 1.8% |
| Standard Deviation (Population) | 1.9% | 1.8% |
Demographics Similar to Iroquois and Immigrants from Thailand by Single Father Households
In terms of single father households, the demographic groups most similar to Iroquois are Belizean (2.6%, a difference of 0.040%), Creek (2.6%, a difference of 0.050%), Seminole (2.6%, a difference of 0.41%), Cuban (2.6%, a difference of 0.55%), and Haitian (2.6%, a difference of 0.89%). Similarly, the demographic groups most similar to Immigrants from Thailand are Immigrants from Somalia (2.5%, a difference of 0.040%), Tongan (2.5%, a difference of 0.41%), Potawatomi (2.5%, a difference of 0.47%), Immigrants from Congo (2.5%, a difference of 0.76%), and Spanish (2.5%, a difference of 0.85%).
| Demographics | Rating | Rank | Single Father Households |
| Immigrants | Somalia | 1.9 /100 | #253 | Tragic 2.5% |
| Immigrants | Thailand | 1.8 /100 | #254 | Tragic 2.5% |
| Tongans | 1.5 /100 | #255 | Tragic 2.5% |
| Potawatomi | 1.4 /100 | #256 | Tragic 2.5% |
| Immigrants | Congo | 1.2 /100 | #257 | Tragic 2.5% |
| Spanish | 1.1 /100 | #258 | Tragic 2.5% |
| Comanche | 1.0 /100 | #259 | Tragic 2.5% |
| Immigrants | Caribbean | 1.0 /100 | #260 | Tragic 2.5% |
| Immigrants | Belize | 0.9 /100 | #261 | Tragic 2.5% |
| Immigrants | Liberia | 0.8 /100 | #262 | Tragic 2.5% |
| Dominicans | 0.8 /100 | #263 | Tragic 2.5% |
| Indonesians | 0.5 /100 | #264 | Tragic 2.6% |
| Immigrants | Micronesia | 0.5 /100 | #265 | Tragic 2.6% |
| French American Indians | 0.5 /100 | #266 | Tragic 2.6% |
| Guamanians/Chamorros | 0.4 /100 | #267 | Tragic 2.6% |
| Haitians | 0.4 /100 | #268 | Tragic 2.6% |
| Cubans | 0.3 /100 | #269 | Tragic 2.6% |
| Seminole | 0.3 /100 | #270 | Tragic 2.6% |
| Creek | 0.2 /100 | #271 | Tragic 2.6% |
| Belizeans | 0.2 /100 | #272 | Tragic 2.6% |
| Iroquois | 0.2 /100 | #273 | Tragic 2.6% |