Latvian vs Costa Rican Male Poverty
COMPARE
Latvian
Costa Rican
Male Poverty
Male Poverty Comparison
Latvians
Costa Ricans
9.6%
MALE POVERTY
99.7/ 100
METRIC RATING
20th/ 347
METRIC RANK
11.0%
MALE POVERTY
63.9/ 100
METRIC RATING
156th/ 347
METRIC RANK
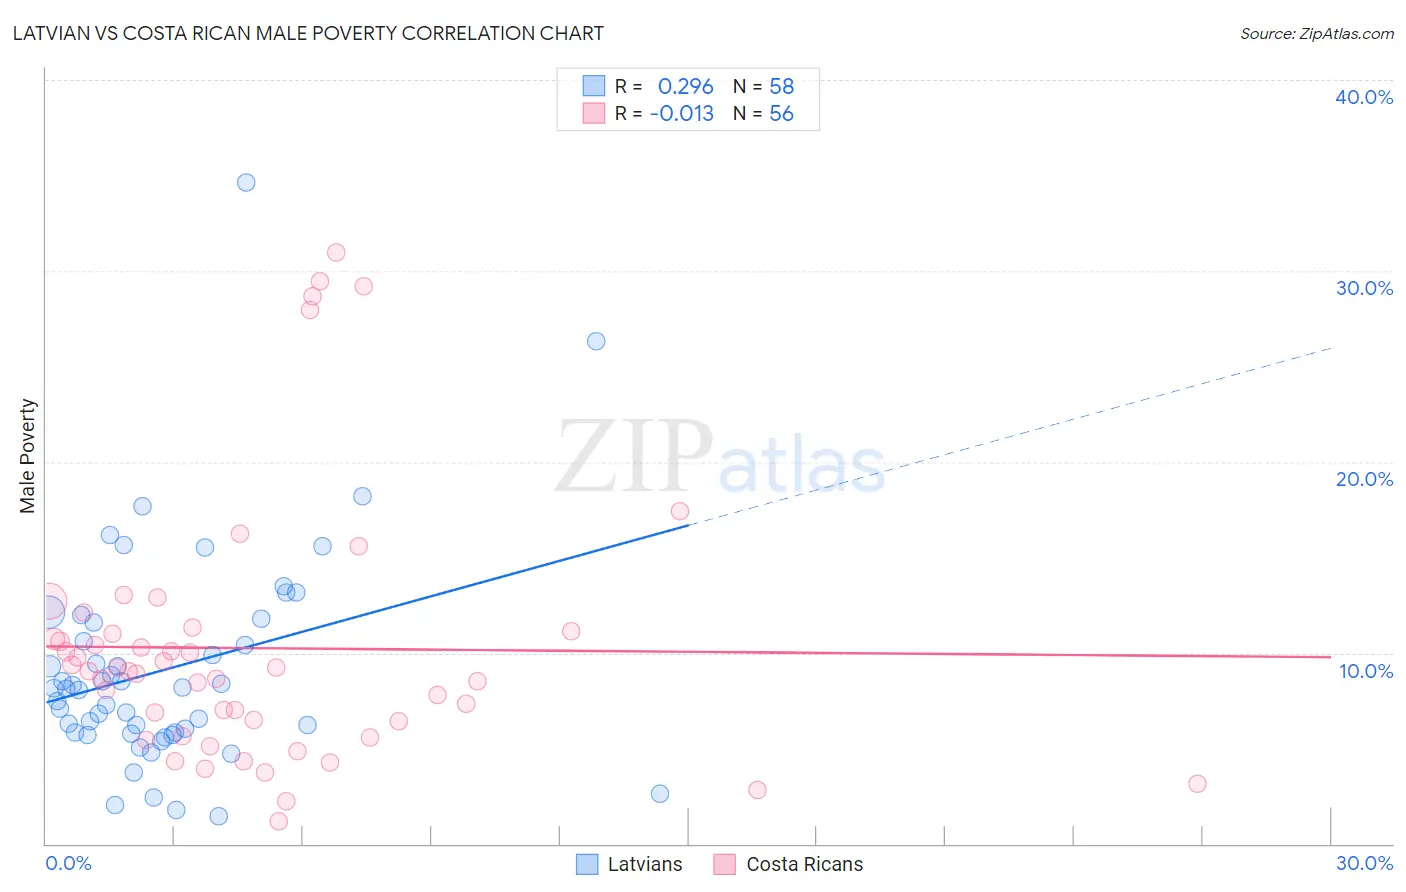
Latvian vs Costa Rican Male Poverty Correlation Chart
The statistical analysis conducted on geographies consisting of 220,591,162 people shows a weak positive correlation between the proportion of Latvians and poverty level among males in the United States with a correlation coefficient (R) of 0.296 and weighted average of 9.6%. Similarly, the statistical analysis conducted on geographies consisting of 253,451,633 people shows no correlation between the proportion of Costa Ricans and poverty level among males in the United States with a correlation coefficient (R) of -0.013 and weighted average of 11.0%, a difference of 15.3%.
Male Poverty Correlation Summary
| Measurement | Latvian | Costa Rican |
| Minimum | 1.5% | 1.1% |
| Maximum | 34.6% | 31.0% |
| Range | 33.2% | 29.8% |
| Mean | 9.2% | 10.2% |
| Median | 8.1% | 9.0% |
| Interquartile 25% (IQ1) | 5.8% | 6.0% |
| Interquartile 75% (IQ3) | 11.6% | 11.0% |
| Interquartile Range (IQR) | 5.8% | 5.0% |
| Standard Deviation (Sample) | 5.7% | 6.9% |
| Standard Deviation (Population) | 5.7% | 6.8% |
Similar Demographics by Male Poverty
Demographics Similar to Latvians by Male Poverty
In terms of male poverty, the demographic groups most similar to Latvians are Immigrants from Hong Kong (9.6%, a difference of 0.10%), Immigrants from Scotland (9.6%, a difference of 0.26%), Lithuanian (9.5%, a difference of 0.28%), Norwegian (9.5%, a difference of 0.45%), and Croatian (9.6%, a difference of 0.51%).
| Demographics | Rating | Rank | Male Poverty |
| Immigrants | Lithuania | 99.9 /100 | #13 | Exceptional 9.4% |
| Immigrants | North Macedonia | 99.8 /100 | #14 | Exceptional 9.4% |
| Bhutanese | 99.8 /100 | #15 | Exceptional 9.5% |
| Luxembourgers | 99.8 /100 | #16 | Exceptional 9.5% |
| Norwegians | 99.8 /100 | #17 | Exceptional 9.5% |
| Lithuanians | 99.8 /100 | #18 | Exceptional 9.5% |
| Immigrants | Hong Kong | 99.7 /100 | #19 | Exceptional 9.6% |
| Latvians | 99.7 /100 | #20 | Exceptional 9.6% |
| Immigrants | Scotland | 99.7 /100 | #21 | Exceptional 9.6% |
| Croatians | 99.7 /100 | #22 | Exceptional 9.6% |
| Italians | 99.7 /100 | #23 | Exceptional 9.6% |
| Swedes | 99.7 /100 | #24 | Exceptional 9.6% |
| Eastern Europeans | 99.6 /100 | #25 | Exceptional 9.6% |
| Burmese | 99.6 /100 | #26 | Exceptional 9.7% |
| Danes | 99.6 /100 | #27 | Exceptional 9.7% |
Demographics Similar to Costa Ricans by Male Poverty
In terms of male poverty, the demographic groups most similar to Costa Ricans are Scotch-Irish (11.0%, a difference of 0.020%), Immigrants from Malaysia (11.0%, a difference of 0.090%), Immigrants from Kazakhstan (11.0%, a difference of 0.10%), Colombian (11.0%, a difference of 0.10%), and Taiwanese (11.0%, a difference of 0.12%).
| Demographics | Rating | Rank | Male Poverty |
| Immigrants | Venezuela | 67.9 /100 | #149 | Good 11.0% |
| Guamanians/Chamorros | 67.6 /100 | #150 | Good 11.0% |
| Venezuelans | 67.4 /100 | #151 | Good 11.0% |
| Immigrants | Nepal | 67.3 /100 | #152 | Good 11.0% |
| Immigrants | Bosnia and Herzegovina | 65.2 /100 | #153 | Good 11.0% |
| Immigrants | Kazakhstan | 64.8 /100 | #154 | Good 11.0% |
| Immigrants | Malaysia | 64.7 /100 | #155 | Good 11.0% |
| Costa Ricans | 63.9 /100 | #156 | Good 11.0% |
| Scotch-Irish | 63.7 /100 | #157 | Good 11.0% |
| Colombians | 63.0 /100 | #158 | Good 11.0% |
| Taiwanese | 62.7 /100 | #159 | Good 11.0% |
| Soviet Union | 60.3 /100 | #160 | Good 11.1% |
| Immigrants | Northern Africa | 59.7 /100 | #161 | Average 11.1% |
| Immigrants | Chile | 57.4 /100 | #162 | Average 11.1% |
| Whites/Caucasians | 56.7 /100 | #163 | Average 11.1% |