Iroquois vs Costa Rican High School Diploma
COMPARE
Iroquois
Costa Rican
High School Diploma
High School Diploma Comparison
Iroquois
Costa Ricans
89.2%
HIGH SCHOOL DIPLOMA
55.1/ 100
METRIC RATING
169th/ 347
METRIC RANK
88.4%
HIGH SCHOOL DIPLOMA
9.6/ 100
METRIC RATING
219th/ 347
METRIC RANK
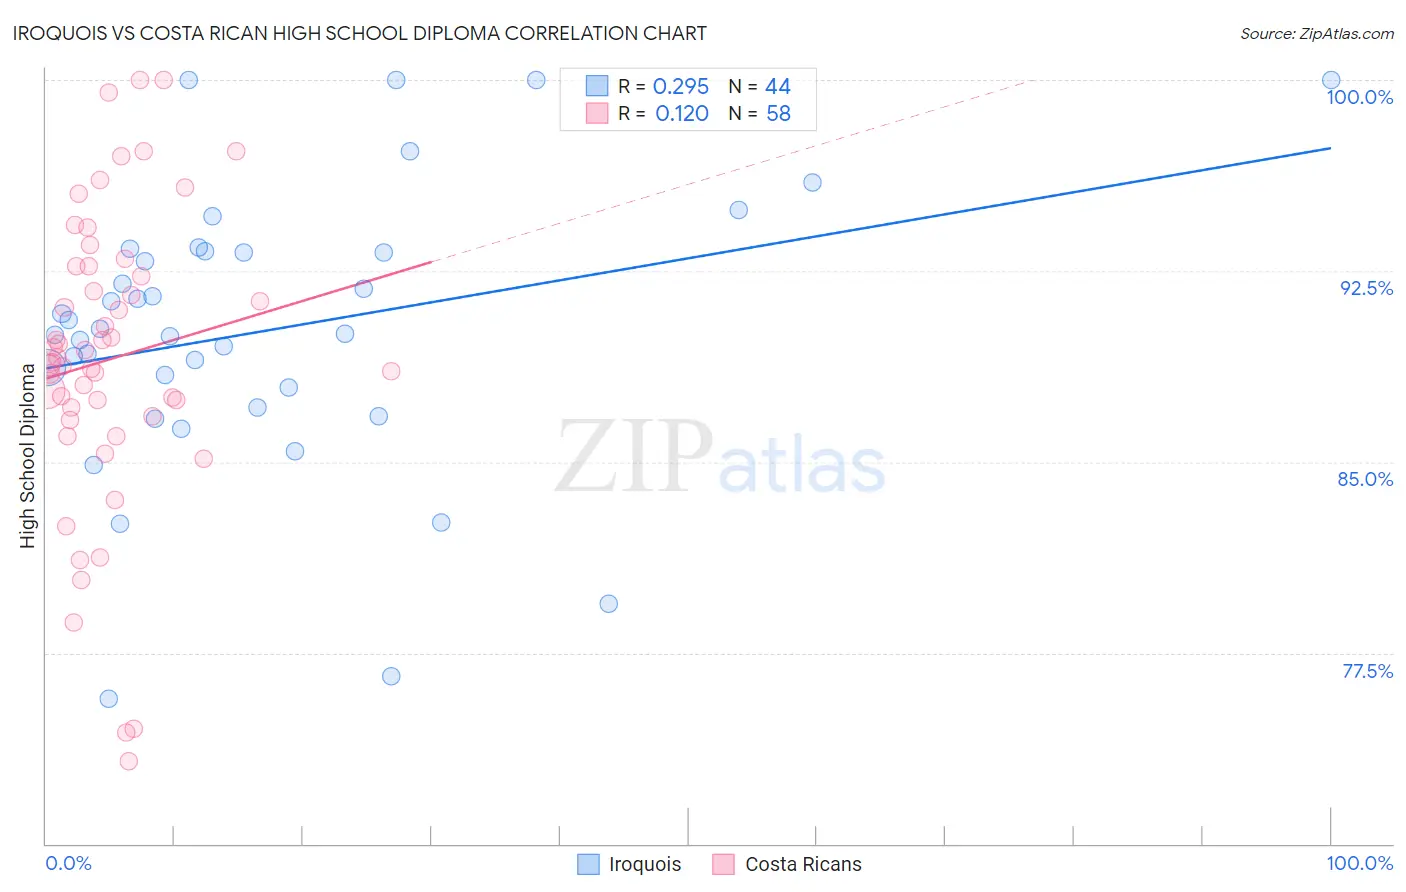
Iroquois vs Costa Rican High School Diploma Correlation Chart
The statistical analysis conducted on geographies consisting of 207,308,653 people shows a weak positive correlation between the proportion of Iroquois and percentage of population with at least high school diploma education in the United States with a correlation coefficient (R) of 0.295 and weighted average of 89.2%. Similarly, the statistical analysis conducted on geographies consisting of 253,601,730 people shows a poor positive correlation between the proportion of Costa Ricans and percentage of population with at least high school diploma education in the United States with a correlation coefficient (R) of 0.120 and weighted average of 88.4%, a difference of 0.93%.
High School Diploma Correlation Summary
| Measurement | Iroquois | Costa Rican |
| Minimum | 75.7% | 73.3% |
| Maximum | 100.0% | 100.0% |
| Range | 24.3% | 26.7% |
| Mean | 90.2% | 89.0% |
| Median | 90.1% | 89.0% |
| Interquartile 25% (IQ1) | 87.5% | 86.8% |
| Interquartile 75% (IQ3) | 93.3% | 92.7% |
| Interquartile Range (IQR) | 5.7% | 5.9% |
| Standard Deviation (Sample) | 5.5% | 5.9% |
| Standard Deviation (Population) | 5.5% | 5.8% |
Similar Demographics by High School Diploma
Demographics Similar to Iroquois by High School Diploma
In terms of high school diploma, the demographic groups most similar to Iroquois are Delaware (89.2%, a difference of 0.010%), Immigrants from Morocco (89.2%, a difference of 0.030%), Spanish (89.2%, a difference of 0.030%), Immigrants from Hong Kong (89.3%, a difference of 0.050%), and Nonimmigrants (89.2%, a difference of 0.050%).
| Demographics | Rating | Rank | High School Diploma |
| Bermudans | 61.1 /100 | #162 | Good 89.3% |
| Cree | 61.1 /100 | #163 | Good 89.3% |
| Immigrants | Nepal | 61.1 /100 | #164 | Good 89.3% |
| Immigrants | Asia | 59.8 /100 | #165 | Average 89.3% |
| Immigrants | Albania | 59.4 /100 | #166 | Average 89.3% |
| Immigrants | Hong Kong | 58.6 /100 | #167 | Average 89.3% |
| Delaware | 55.8 /100 | #168 | Average 89.2% |
| Iroquois | 55.1 /100 | #169 | Average 89.2% |
| Immigrants | Morocco | 53.3 /100 | #170 | Average 89.2% |
| Spanish | 52.9 /100 | #171 | Average 89.2% |
| Immigrants | Nonimmigrants | 51.8 /100 | #172 | Average 89.2% |
| Immigrants | Indonesia | 50.3 /100 | #173 | Average 89.1% |
| Hmong | 50.0 /100 | #174 | Average 89.1% |
| Immigrants | Western Asia | 49.0 /100 | #175 | Average 89.1% |
| Osage | 48.9 /100 | #176 | Average 89.1% |
Demographics Similar to Costa Ricans by High School Diploma
In terms of high school diploma, the demographic groups most similar to Costa Ricans are Tongan (88.4%, a difference of 0.0%), Immigrants from Bolivia (88.4%, a difference of 0.030%), Immigrants from Africa (88.4%, a difference of 0.040%), Immigrants from Cameroon (88.4%, a difference of 0.050%), and Crow (88.4%, a difference of 0.050%).
| Demographics | Rating | Rank | High School Diploma |
| South American Indians | 12.2 /100 | #212 | Poor 88.5% |
| Immigrants | Somalia | 11.3 /100 | #213 | Poor 88.4% |
| Immigrants | Cameroon | 10.9 /100 | #214 | Poor 88.4% |
| Crow | 10.9 /100 | #215 | Poor 88.4% |
| Chickasaw | 10.7 /100 | #216 | Poor 88.4% |
| Immigrants | Africa | 10.6 /100 | #217 | Poor 88.4% |
| Immigrants | Bolivia | 10.3 /100 | #218 | Poor 88.4% |
| Costa Ricans | 9.6 /100 | #219 | Tragic 88.4% |
| Tongans | 9.5 /100 | #220 | Tragic 88.4% |
| Immigrants | Afghanistan | 8.6 /100 | #221 | Tragic 88.3% |
| Colville | 7.8 /100 | #222 | Tragic 88.3% |
| Immigrants | Zaire | 7.6 /100 | #223 | Tragic 88.3% |
| Shoshone | 7.0 /100 | #224 | Tragic 88.3% |
| Creek | 6.9 /100 | #225 | Tragic 88.3% |
| Uruguayans | 5.6 /100 | #226 | Tragic 88.2% |