Immigrants from Czechoslovakia vs Haitian Poverty
COMPARE
Immigrants from Czechoslovakia
Haitian
Poverty
Poverty Comparison
Immigrants from Czechoslovakia
Haitians
11.0%
POVERTY
98.9/ 100
METRIC RATING
46th/ 347
METRIC RANK
14.9%
POVERTY
0.0/ 100
METRIC RATING
280th/ 347
METRIC RANK
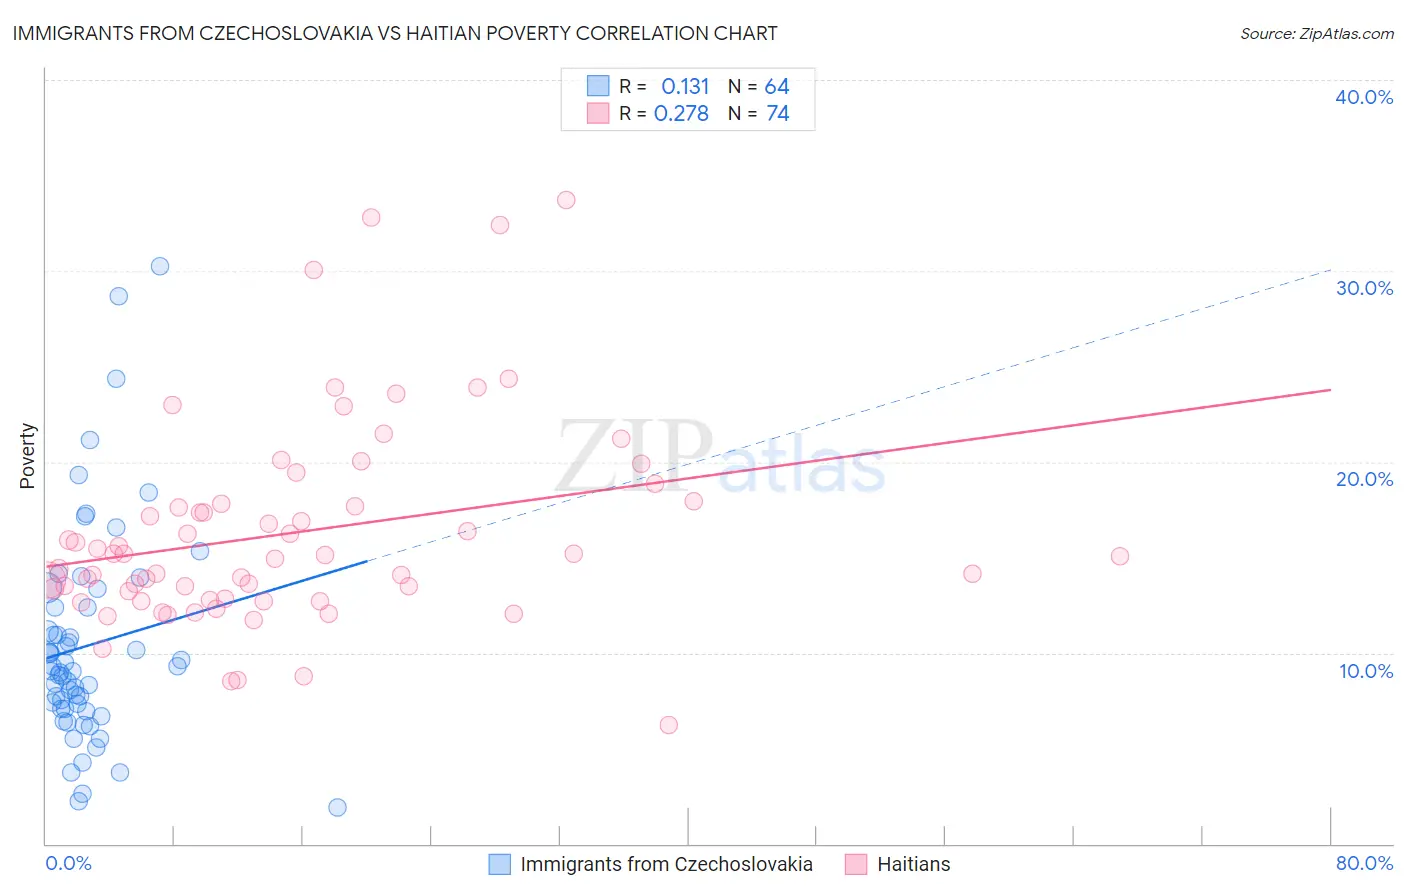
Immigrants from Czechoslovakia vs Haitian Poverty Correlation Chart
The statistical analysis conducted on geographies consisting of 195,452,968 people shows a poor positive correlation between the proportion of Immigrants from Czechoslovakia and poverty level in the United States with a correlation coefficient (R) of 0.131 and weighted average of 11.0%. Similarly, the statistical analysis conducted on geographies consisting of 287,739,300 people shows a weak positive correlation between the proportion of Haitians and poverty level in the United States with a correlation coefficient (R) of 0.278 and weighted average of 14.9%, a difference of 35.7%.
Poverty Correlation Summary
| Measurement | Immigrants from Czechoslovakia | Haitian |
| Minimum | 1.9% | 6.2% |
| Maximum | 30.2% | 33.7% |
| Range | 28.3% | 27.5% |
| Mean | 10.4% | 16.3% |
| Median | 9.1% | 15.1% |
| Interquartile 25% (IQ1) | 7.1% | 12.8% |
| Interquartile 75% (IQ3) | 12.4% | 17.8% |
| Interquartile Range (IQR) | 5.3% | 5.0% |
| Standard Deviation (Sample) | 5.6% | 5.4% |
| Standard Deviation (Population) | 5.6% | 5.4% |
Similar Demographics by Poverty
Demographics Similar to Immigrants from Czechoslovakia by Poverty
In terms of poverty, the demographic groups most similar to Immigrants from Czechoslovakia are Immigrants from Romania (11.0%, a difference of 0.010%), Slovene (11.0%, a difference of 0.060%), Immigrants from Japan (11.0%, a difference of 0.070%), Turkish (11.0%, a difference of 0.080%), and Asian (11.0%, a difference of 0.10%).
| Demographics | Rating | Rank | Poverty |
| Immigrants | Pakistan | 99.3 /100 | #39 | Exceptional 10.8% |
| Russians | 99.3 /100 | #40 | Exceptional 10.9% |
| Immigrants | Iran | 99.2 /100 | #41 | Exceptional 10.9% |
| Koreans | 99.2 /100 | #42 | Exceptional 10.9% |
| Immigrants | Singapore | 99.2 /100 | #43 | Exceptional 10.9% |
| Immigrants | Moldova | 99.1 /100 | #44 | Exceptional 10.9% |
| Turks | 98.9 /100 | #45 | Exceptional 11.0% |
| Immigrants | Czechoslovakia | 98.9 /100 | #46 | Exceptional 11.0% |
| Immigrants | Romania | 98.9 /100 | #47 | Exceptional 11.0% |
| Slovenes | 98.9 /100 | #48 | Exceptional 11.0% |
| Immigrants | Japan | 98.9 /100 | #49 | Exceptional 11.0% |
| Asians | 98.9 /100 | #50 | Exceptional 11.0% |
| Immigrants | Croatia | 98.7 /100 | #51 | Exceptional 11.0% |
| Immigrants | Philippines | 98.7 /100 | #52 | Exceptional 11.0% |
| Immigrants | Austria | 98.6 /100 | #53 | Exceptional 11.1% |
Demographics Similar to Haitians by Poverty
In terms of poverty, the demographic groups most similar to Haitians are Immigrants from Barbados (14.9%, a difference of 0.070%), Immigrants from St. Vincent and the Grenadines (14.9%, a difference of 0.20%), Comanche (15.0%, a difference of 0.40%), Belizean (14.8%, a difference of 0.49%), and Bangladeshi (14.8%, a difference of 0.51%).
| Demographics | Rating | Rank | Poverty |
| Spanish Americans | 0.0 /100 | #273 | Tragic 14.7% |
| Barbadians | 0.0 /100 | #274 | Tragic 14.8% |
| Immigrants | West Indies | 0.0 /100 | #275 | Tragic 14.8% |
| Immigrants | Bahamas | 0.0 /100 | #276 | Tragic 14.8% |
| Bangladeshis | 0.0 /100 | #277 | Tragic 14.8% |
| Belizeans | 0.0 /100 | #278 | Tragic 14.8% |
| Immigrants | St. Vincent and the Grenadines | 0.0 /100 | #279 | Tragic 14.9% |
| Haitians | 0.0 /100 | #280 | Tragic 14.9% |
| Immigrants | Barbados | 0.0 /100 | #281 | Tragic 14.9% |
| Comanche | 0.0 /100 | #282 | Tragic 15.0% |
| Immigrants | Haiti | 0.0 /100 | #283 | Tragic 15.0% |
| West Indians | 0.0 /100 | #284 | Tragic 15.0% |
| Vietnamese | 0.0 /100 | #285 | Tragic 15.0% |
| Immigrants | Latin America | 0.0 /100 | #286 | Tragic 15.0% |
| Inupiat | 0.0 /100 | #287 | Tragic 15.1% |