Immigrants from Switzerland vs Haitian Poverty
COMPARE
Immigrants from Switzerland
Haitian
Poverty
Poverty Comparison
Immigrants from Switzerland
Haitians
11.8%
POVERTY
83.0/ 100
METRIC RATING
137th/ 347
METRIC RANK
14.9%
POVERTY
0.0/ 100
METRIC RATING
280th/ 347
METRIC RANK
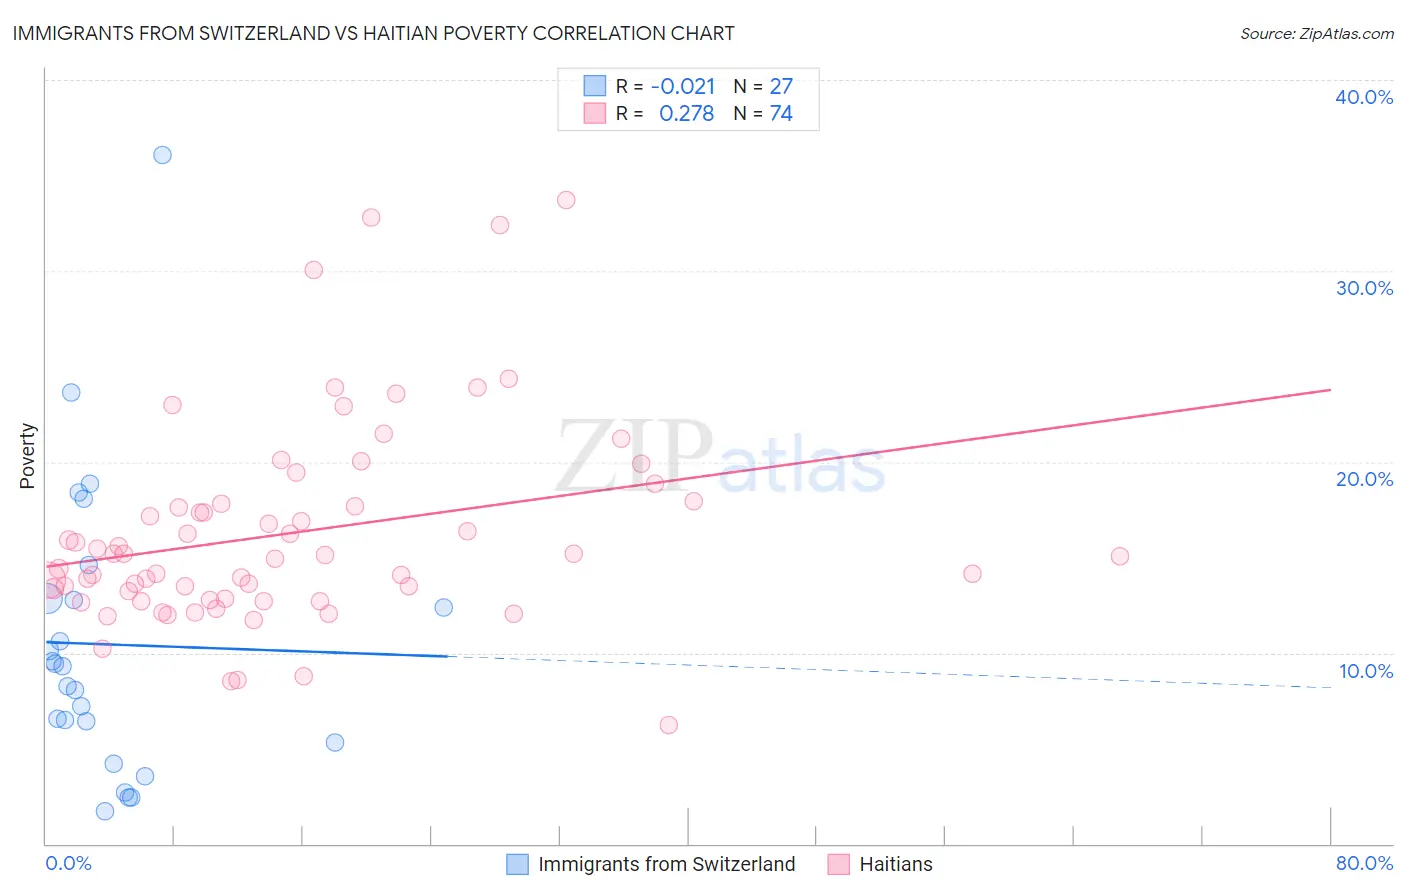
Immigrants from Switzerland vs Haitian Poverty Correlation Chart
The statistical analysis conducted on geographies consisting of 148,064,410 people shows no correlation between the proportion of Immigrants from Switzerland and poverty level in the United States with a correlation coefficient (R) of -0.021 and weighted average of 11.8%. Similarly, the statistical analysis conducted on geographies consisting of 287,739,300 people shows a weak positive correlation between the proportion of Haitians and poverty level in the United States with a correlation coefficient (R) of 0.278 and weighted average of 14.9%, a difference of 25.7%.
Poverty Correlation Summary
| Measurement | Immigrants from Switzerland | Haitian |
| Minimum | 1.7% | 6.2% |
| Maximum | 36.1% | 33.7% |
| Range | 34.3% | 27.5% |
| Mean | 10.4% | 16.3% |
| Median | 9.3% | 15.1% |
| Interquartile 25% (IQ1) | 5.3% | 12.8% |
| Interquartile 75% (IQ3) | 12.8% | 17.8% |
| Interquartile Range (IQR) | 7.6% | 5.0% |
| Standard Deviation (Sample) | 7.6% | 5.4% |
| Standard Deviation (Population) | 7.5% | 5.4% |
Similar Demographics by Poverty
Demographics Similar to Immigrants from Switzerland by Poverty
In terms of poverty, the demographic groups most similar to Immigrants from Switzerland are Immigrants from Jordan (11.9%, a difference of 0.11%), Pakistani (11.9%, a difference of 0.14%), Chilean (11.8%, a difference of 0.21%), Immigrants from Peru (11.9%, a difference of 0.33%), and Immigrants from Vietnam (11.8%, a difference of 0.41%).
| Demographics | Rating | Rank | Poverty |
| Immigrants | Ukraine | 86.6 /100 | #130 | Excellent 11.8% |
| French | 86.1 /100 | #131 | Excellent 11.8% |
| Peruvians | 85.6 /100 | #132 | Excellent 11.8% |
| Immigrants | Western Europe | 85.2 /100 | #133 | Excellent 11.8% |
| Yugoslavians | 85.2 /100 | #134 | Excellent 11.8% |
| Immigrants | Vietnam | 85.2 /100 | #135 | Excellent 11.8% |
| Chileans | 84.2 /100 | #136 | Excellent 11.8% |
| Immigrants | Switzerland | 83.0 /100 | #137 | Excellent 11.8% |
| Immigrants | Jordan | 82.4 /100 | #138 | Excellent 11.9% |
| Pakistanis | 82.2 /100 | #139 | Excellent 11.9% |
| Immigrants | Peru | 81.1 /100 | #140 | Excellent 11.9% |
| Immigrants | France | 80.5 /100 | #141 | Excellent 11.9% |
| Basques | 80.4 /100 | #142 | Excellent 11.9% |
| Brazilians | 79.7 /100 | #143 | Good 11.9% |
| Icelanders | 77.9 /100 | #144 | Good 11.9% |
Demographics Similar to Haitians by Poverty
In terms of poverty, the demographic groups most similar to Haitians are Immigrants from Barbados (14.9%, a difference of 0.070%), Immigrants from St. Vincent and the Grenadines (14.9%, a difference of 0.20%), Comanche (15.0%, a difference of 0.40%), Belizean (14.8%, a difference of 0.49%), and Bangladeshi (14.8%, a difference of 0.51%).
| Demographics | Rating | Rank | Poverty |
| Spanish Americans | 0.0 /100 | #273 | Tragic 14.7% |
| Barbadians | 0.0 /100 | #274 | Tragic 14.8% |
| Immigrants | West Indies | 0.0 /100 | #275 | Tragic 14.8% |
| Immigrants | Bahamas | 0.0 /100 | #276 | Tragic 14.8% |
| Bangladeshis | 0.0 /100 | #277 | Tragic 14.8% |
| Belizeans | 0.0 /100 | #278 | Tragic 14.8% |
| Immigrants | St. Vincent and the Grenadines | 0.0 /100 | #279 | Tragic 14.9% |
| Haitians | 0.0 /100 | #280 | Tragic 14.9% |
| Immigrants | Barbados | 0.0 /100 | #281 | Tragic 14.9% |
| Comanche | 0.0 /100 | #282 | Tragic 15.0% |
| Immigrants | Haiti | 0.0 /100 | #283 | Tragic 15.0% |
| West Indians | 0.0 /100 | #284 | Tragic 15.0% |
| Vietnamese | 0.0 /100 | #285 | Tragic 15.0% |
| Immigrants | Latin America | 0.0 /100 | #286 | Tragic 15.0% |
| Inupiat | 0.0 /100 | #287 | Tragic 15.1% |