Iraqi vs Assyrian/Chaldean/Syriac Householder Income Ages 45 - 64 years
COMPARE
Iraqi
Assyrian/Chaldean/Syriac
Householder Income Ages 45 - 64 years
Householder Income Ages 45 - 64 years Comparison
Iraqis
Assyrians/Chaldeans/Syriacs
$99,387
HOUSEHOLDER INCOME AGES 45 - 64 YEARS
38.5/ 100
METRIC RATING
187th/ 347
METRIC RANK
$110,201
HOUSEHOLDER INCOME AGES 45 - 64 YEARS
99.3/ 100
METRIC RATING
72nd/ 347
METRIC RANK
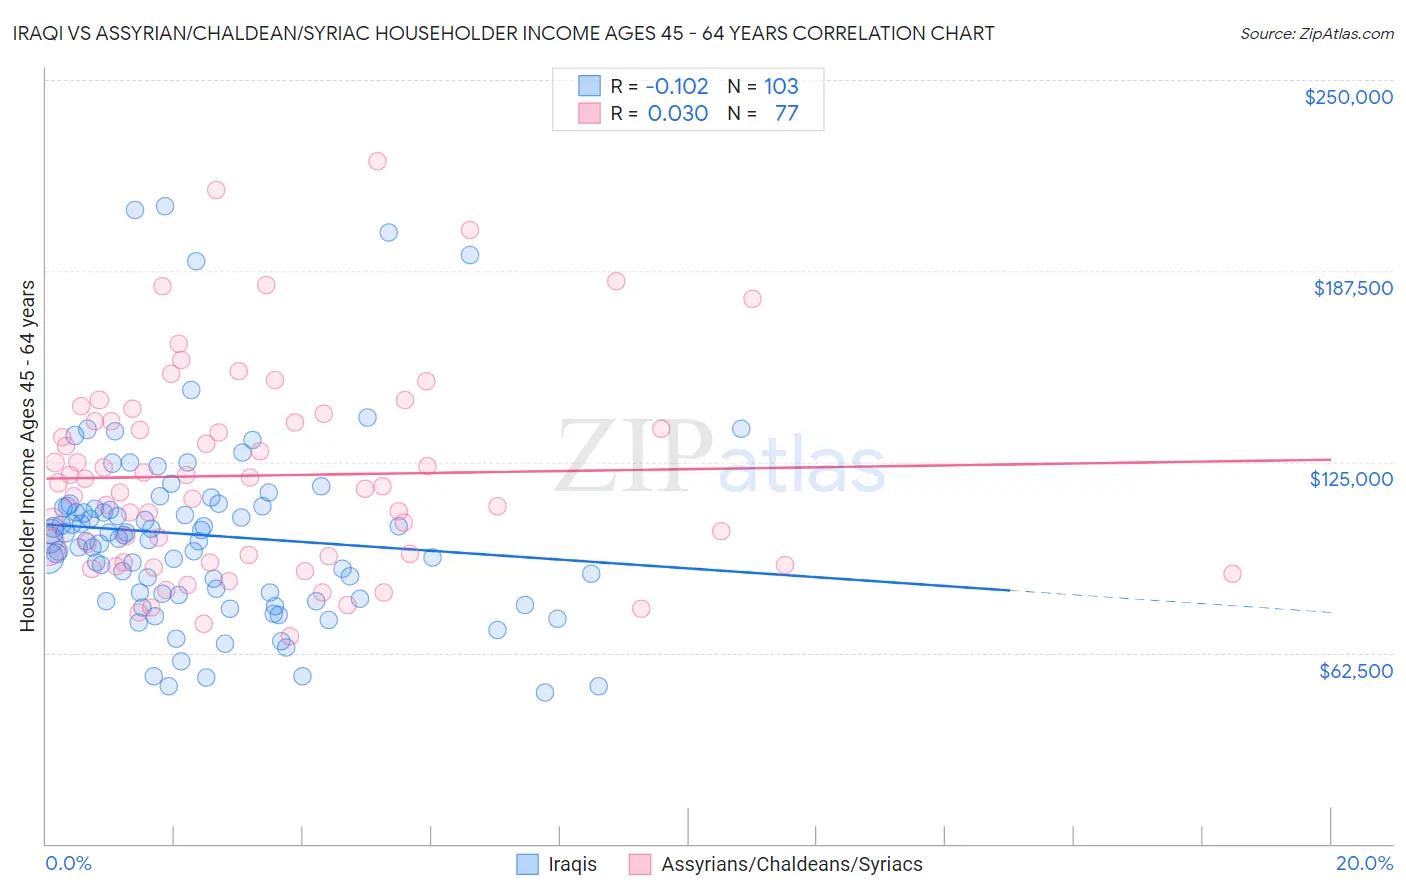
Iraqi vs Assyrian/Chaldean/Syriac Householder Income Ages 45 - 64 years Correlation Chart
The statistical analysis conducted on geographies consisting of 170,546,926 people shows a poor negative correlation between the proportion of Iraqis and household income with householder between the ages 45 and 64 in the United States with a correlation coefficient (R) of -0.102 and weighted average of $99,387. Similarly, the statistical analysis conducted on geographies consisting of 110,244,252 people shows no correlation between the proportion of Assyrians/Chaldeans/Syriacs and household income with householder between the ages 45 and 64 in the United States with a correlation coefficient (R) of 0.030 and weighted average of $110,201, a difference of 10.9%.
Householder Income Ages 45 - 64 years Correlation Summary
| Measurement | Iraqi | Assyrian/Chaldean/Syriac |
| Minimum | $49,554 | $67,992 |
| Maximum | $208,614 | $223,409 |
| Range | $159,060 | $155,417 |
| Mean | $101,029 | $120,547 |
| Median | $99,398 | $117,054 |
| Interquartile 25% (IQ1) | $81,325 | $93,085 |
| Interquartile 75% (IQ3) | $110,313 | $138,155 |
| Interquartile Range (IQR) | $28,988 | $45,070 |
| Standard Deviation (Sample) | $30,760 | $33,489 |
| Standard Deviation (Population) | $30,611 | $33,271 |
Similar Demographics by Householder Income Ages 45 - 64 years
Demographics Similar to Iraqis by Householder Income Ages 45 - 64 years
In terms of householder income ages 45 - 64 years, the demographic groups most similar to Iraqis are Immigrants from Portugal ($99,203, a difference of 0.19%), Immigrants from South America ($99,126, a difference of 0.26%), Dutch ($99,650, a difference of 0.27%), French Canadian ($99,093, a difference of 0.30%), and Colombian ($99,772, a difference of 0.39%).
| Demographics | Rating | Rank | Householder Income Ages 45 - 64 years |
| Aleuts | 46.6 /100 | #180 | Average $100,052 |
| Immigrants | Immigrants | 45.3 /100 | #181 | Average $99,943 |
| Finns | 44.8 /100 | #182 | Average $99,904 |
| Spaniards | 44.6 /100 | #183 | Average $99,889 |
| French | 43.8 /100 | #184 | Average $99,824 |
| Colombians | 43.2 /100 | #185 | Average $99,772 |
| Dutch | 41.7 /100 | #186 | Average $99,650 |
| Iraqis | 38.5 /100 | #187 | Fair $99,387 |
| Immigrants | Portugal | 36.3 /100 | #188 | Fair $99,203 |
| Immigrants | South America | 35.4 /100 | #189 | Fair $99,126 |
| French Canadians | 35.1 /100 | #190 | Fair $99,093 |
| Kenyans | 33.7 /100 | #191 | Fair $98,970 |
| Celtics | 32.9 /100 | #192 | Fair $98,896 |
| Hawaiians | 31.6 /100 | #193 | Fair $98,778 |
| Uruguayans | 30.3 /100 | #194 | Fair $98,660 |
Demographics Similar to Assyrians/Chaldeans/Syriacs by Householder Income Ages 45 - 64 years
In terms of householder income ages 45 - 64 years, the demographic groups most similar to Assyrians/Chaldeans/Syriacs are Italian ($110,224, a difference of 0.020%), Argentinean ($110,103, a difference of 0.090%), Korean ($110,334, a difference of 0.12%), Immigrants from Italy ($110,434, a difference of 0.21%), and Immigrants from Egypt ($109,941, a difference of 0.24%).
| Demographics | Rating | Rank | Householder Income Ages 45 - 64 years |
| Immigrants | Belarus | 99.6 /100 | #65 | Exceptional $111,430 |
| New Zealanders | 99.6 /100 | #66 | Exceptional $111,286 |
| Laotians | 99.5 /100 | #67 | Exceptional $111,051 |
| Immigrants | Romania | 99.4 /100 | #68 | Exceptional $110,633 |
| Immigrants | Italy | 99.4 /100 | #69 | Exceptional $110,434 |
| Koreans | 99.3 /100 | #70 | Exceptional $110,334 |
| Italians | 99.3 /100 | #71 | Exceptional $110,224 |
| Assyrians/Chaldeans/Syriacs | 99.3 /100 | #72 | Exceptional $110,201 |
| Argentineans | 99.3 /100 | #73 | Exceptional $110,103 |
| Immigrants | Egypt | 99.2 /100 | #74 | Exceptional $109,941 |
| South Africans | 99.1 /100 | #75 | Exceptional $109,719 |
| Paraguayans | 99.0 /100 | #76 | Exceptional $109,447 |
| Immigrants | England | 99.0 /100 | #77 | Exceptional $109,446 |
| Immigrants | Canada | 99.0 /100 | #78 | Exceptional $109,402 |
| Immigrants | Bulgaria | 98.9 /100 | #79 | Exceptional $109,379 |