Iraqi vs Seminole Single Male Poverty
COMPARE
Iraqi
Seminole
Single Male Poverty
Single Male Poverty Comparison
Iraqis
Seminole
12.3%
SINGLE MALE POVERTY
95.1/ 100
METRIC RATING
107th/ 347
METRIC RANK
16.0%
SINGLE MALE POVERTY
0.0/ 100
METRIC RATING
311th/ 347
METRIC RANK
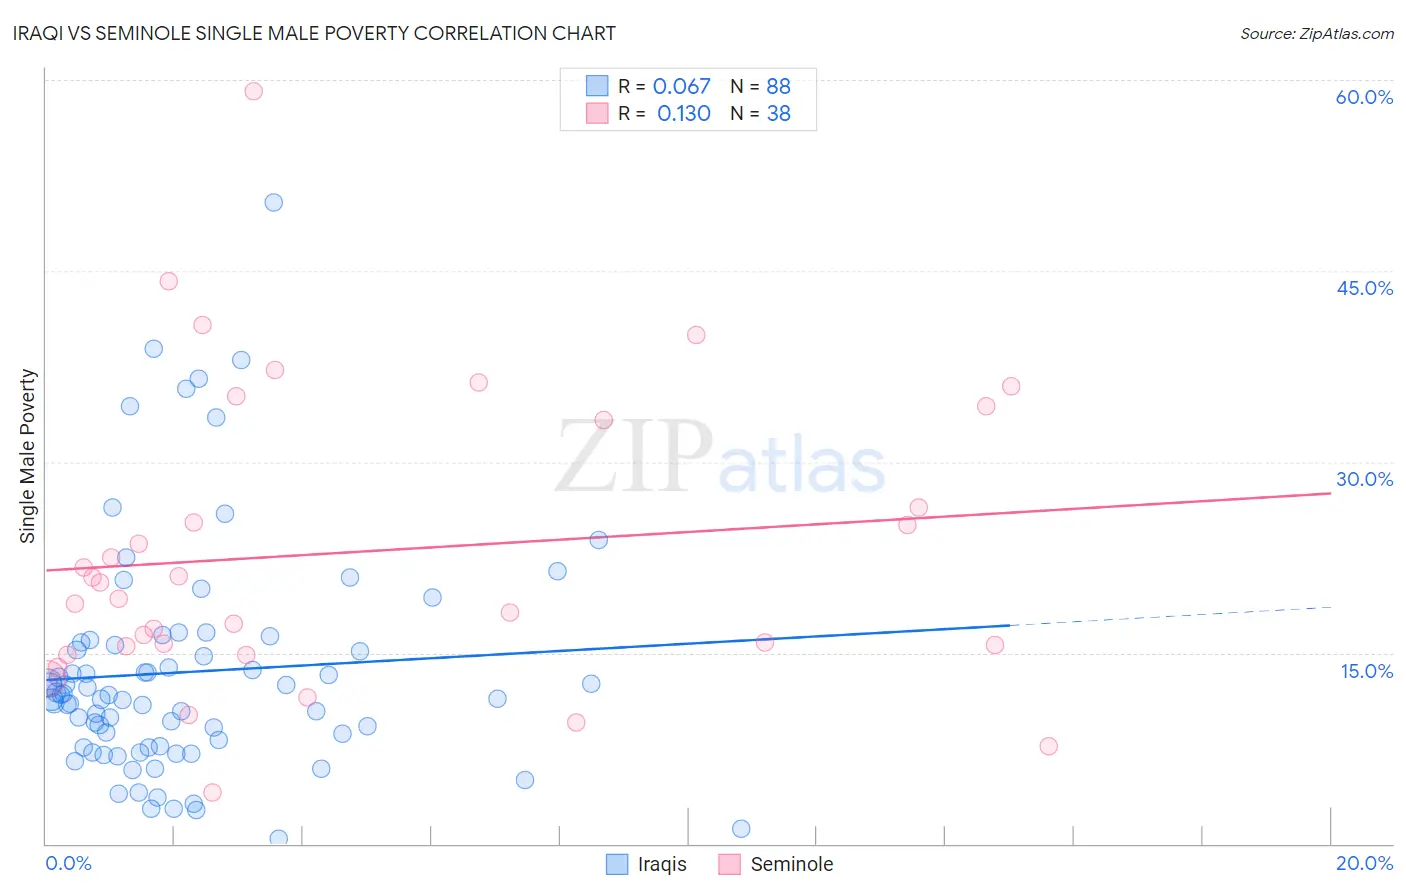
Iraqi vs Seminole Single Male Poverty Correlation Chart
The statistical analysis conducted on geographies consisting of 160,224,189 people shows a slight positive correlation between the proportion of Iraqis and poverty level among single males in the United States with a correlation coefficient (R) of 0.067 and weighted average of 12.3%. Similarly, the statistical analysis conducted on geographies consisting of 113,333,266 people shows a poor positive correlation between the proportion of Seminole and poverty level among single males in the United States with a correlation coefficient (R) of 0.130 and weighted average of 16.0%, a difference of 30.2%.
Single Male Poverty Correlation Summary
| Measurement | Iraqi | Seminole |
| Minimum | 0.42% | 4.0% |
| Maximum | 50.4% | 59.1% |
| Range | 50.0% | 55.1% |
| Mean | 13.5% | 22.9% |
| Median | 11.5% | 19.9% |
| Interquartile 25% (IQ1) | 7.6% | 15.5% |
| Interquartile 75% (IQ3) | 15.7% | 33.3% |
| Interquartile Range (IQR) | 8.1% | 17.9% |
| Standard Deviation (Sample) | 9.1% | 11.7% |
| Standard Deviation (Population) | 9.1% | 11.6% |
Similar Demographics by Single Male Poverty
Demographics Similar to Iraqis by Single Male Poverty
In terms of single male poverty, the demographic groups most similar to Iraqis are Immigrants from Eastern Africa (12.3%, a difference of 0.020%), Ugandan (12.3%, a difference of 0.15%), Immigrants from Morocco (12.3%, a difference of 0.18%), Jordanian (12.3%, a difference of 0.26%), and Immigrants from Portugal (12.3%, a difference of 0.38%).
| Demographics | Rating | Rank | Single Male Poverty |
| Immigrants | Australia | 97.1 /100 | #100 | Exceptional 12.2% |
| Immigrants | Latvia | 97.0 /100 | #101 | Exceptional 12.2% |
| Immigrants | Europe | 97.0 /100 | #102 | Exceptional 12.2% |
| Immigrants | Armenia | 96.7 /100 | #103 | Exceptional 12.2% |
| Immigrants | Kazakhstan | 96.7 /100 | #104 | Exceptional 12.2% |
| Jordanians | 95.9 /100 | #105 | Exceptional 12.3% |
| Immigrants | Morocco | 95.6 /100 | #106 | Exceptional 12.3% |
| Iraqis | 95.1 /100 | #107 | Exceptional 12.3% |
| Immigrants | Eastern Africa | 95.0 /100 | #108 | Exceptional 12.3% |
| Ugandans | 94.5 /100 | #109 | Exceptional 12.3% |
| Immigrants | Portugal | 93.6 /100 | #110 | Exceptional 12.3% |
| Immigrants | North Macedonia | 93.6 /100 | #111 | Exceptional 12.3% |
| Kenyans | 93.3 /100 | #112 | Exceptional 12.4% |
| Pakistanis | 92.4 /100 | #113 | Exceptional 12.4% |
| Nicaraguans | 92.1 /100 | #114 | Exceptional 12.4% |
Demographics Similar to Seminole by Single Male Poverty
In terms of single male poverty, the demographic groups most similar to Seminole are Comanche (16.0%, a difference of 0.0%), Cherokee (16.1%, a difference of 0.23%), Alaskan Athabascan (16.1%, a difference of 0.52%), Yakama (15.9%, a difference of 0.54%), and Cheyenne (16.1%, a difference of 0.57%).
| Demographics | Rating | Rank | Single Male Poverty |
| Alaska Natives | 0.0 /100 | #304 | Tragic 15.4% |
| Blackfeet | 0.0 /100 | #305 | Tragic 15.5% |
| Pennsylvania Germans | 0.0 /100 | #306 | Tragic 15.6% |
| Ute | 0.0 /100 | #307 | Tragic 15.7% |
| Potawatomi | 0.0 /100 | #308 | Tragic 15.8% |
| Americans | 0.0 /100 | #309 | Tragic 15.8% |
| Yakama | 0.0 /100 | #310 | Tragic 15.9% |
| Seminole | 0.0 /100 | #311 | Tragic 16.0% |
| Comanche | 0.0 /100 | #312 | Tragic 16.0% |
| Cherokee | 0.0 /100 | #313 | Tragic 16.1% |
| Alaskan Athabascans | 0.0 /100 | #314 | Tragic 16.1% |
| Cheyenne | 0.0 /100 | #315 | Tragic 16.1% |
| Dutch West Indians | 0.0 /100 | #316 | Tragic 16.1% |
| Blacks/African Americans | 0.0 /100 | #317 | Tragic 16.2% |
| Chickasaw | 0.0 /100 | #318 | Tragic 16.3% |