Iraqi vs Immigrants from Somalia Single Male Poverty
COMPARE
Iraqi
Immigrants from Somalia
Single Male Poverty
Single Male Poverty Comparison
Iraqis
Immigrants from Somalia
12.3%
SINGLE MALE POVERTY
95.1/ 100
METRIC RATING
107th/ 347
METRIC RANK
13.6%
SINGLE MALE POVERTY
1.0/ 100
METRIC RATING
250th/ 347
METRIC RANK
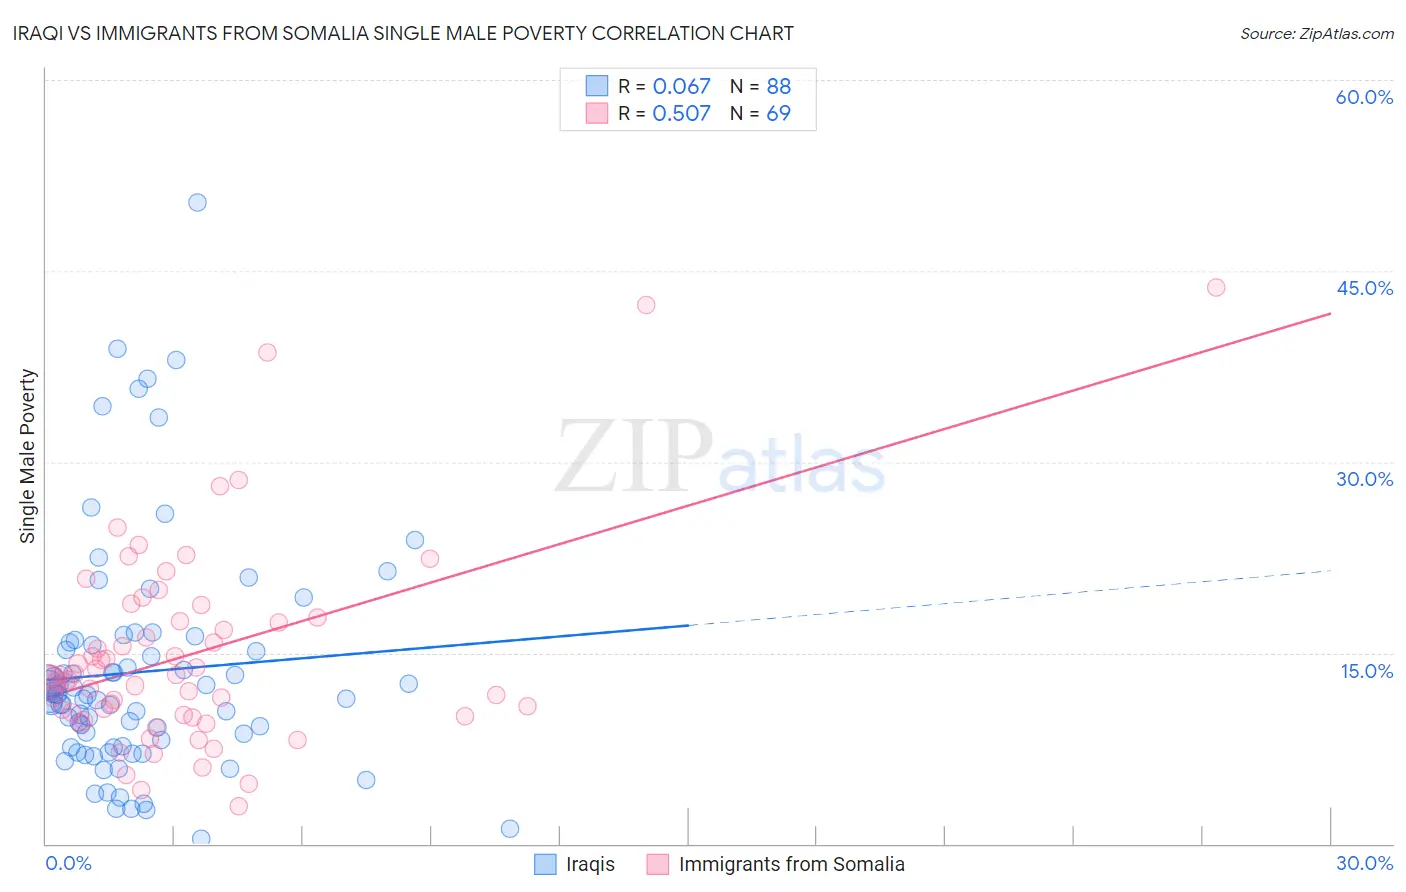
Iraqi vs Immigrants from Somalia Single Male Poverty Correlation Chart
The statistical analysis conducted on geographies consisting of 160,224,189 people shows a slight positive correlation between the proportion of Iraqis and poverty level among single males in the United States with a correlation coefficient (R) of 0.067 and weighted average of 12.3%. Similarly, the statistical analysis conducted on geographies consisting of 88,720,469 people shows a substantial positive correlation between the proportion of Immigrants from Somalia and poverty level among single males in the United States with a correlation coefficient (R) of 0.507 and weighted average of 13.6%, a difference of 10.4%.
Single Male Poverty Correlation Summary
| Measurement | Iraqi | Immigrants from Somalia |
| Minimum | 0.42% | 3.0% |
| Maximum | 50.4% | 43.7% |
| Range | 50.0% | 40.7% |
| Mean | 13.5% | 14.9% |
| Median | 11.5% | 13.1% |
| Interquartile 25% (IQ1) | 7.6% | 10.0% |
| Interquartile 75% (IQ3) | 15.7% | 17.7% |
| Interquartile Range (IQR) | 8.1% | 7.6% |
| Standard Deviation (Sample) | 9.1% | 7.9% |
| Standard Deviation (Population) | 9.1% | 7.9% |
Similar Demographics by Single Male Poverty
Demographics Similar to Iraqis by Single Male Poverty
In terms of single male poverty, the demographic groups most similar to Iraqis are Immigrants from Eastern Africa (12.3%, a difference of 0.020%), Ugandan (12.3%, a difference of 0.15%), Immigrants from Morocco (12.3%, a difference of 0.18%), Jordanian (12.3%, a difference of 0.26%), and Immigrants from Portugal (12.3%, a difference of 0.38%).
| Demographics | Rating | Rank | Single Male Poverty |
| Immigrants | Australia | 97.1 /100 | #100 | Exceptional 12.2% |
| Immigrants | Latvia | 97.0 /100 | #101 | Exceptional 12.2% |
| Immigrants | Europe | 97.0 /100 | #102 | Exceptional 12.2% |
| Immigrants | Armenia | 96.7 /100 | #103 | Exceptional 12.2% |
| Immigrants | Kazakhstan | 96.7 /100 | #104 | Exceptional 12.2% |
| Jordanians | 95.9 /100 | #105 | Exceptional 12.3% |
| Immigrants | Morocco | 95.6 /100 | #106 | Exceptional 12.3% |
| Iraqis | 95.1 /100 | #107 | Exceptional 12.3% |
| Immigrants | Eastern Africa | 95.0 /100 | #108 | Exceptional 12.3% |
| Ugandans | 94.5 /100 | #109 | Exceptional 12.3% |
| Immigrants | Portugal | 93.6 /100 | #110 | Exceptional 12.3% |
| Immigrants | North Macedonia | 93.6 /100 | #111 | Exceptional 12.3% |
| Kenyans | 93.3 /100 | #112 | Exceptional 12.4% |
| Pakistanis | 92.4 /100 | #113 | Exceptional 12.4% |
| Nicaraguans | 92.1 /100 | #114 | Exceptional 12.4% |
Demographics Similar to Immigrants from Somalia by Single Male Poverty
In terms of single male poverty, the demographic groups most similar to Immigrants from Somalia are Spanish (13.6%, a difference of 0.020%), Immigrants from Zaire (13.6%, a difference of 0.11%), Finnish (13.6%, a difference of 0.15%), Czech (13.5%, a difference of 0.26%), and Belgian (13.5%, a difference of 0.29%).
| Demographics | Rating | Rank | Single Male Poverty |
| Barbadians | 2.1 /100 | #243 | Tragic 13.4% |
| Immigrants | Senegal | 1.7 /100 | #244 | Tragic 13.5% |
| Immigrants | Latin America | 1.3 /100 | #245 | Tragic 13.5% |
| Immigrants | Micronesia | 1.2 /100 | #246 | Tragic 13.5% |
| Belgians | 1.2 /100 | #247 | Tragic 13.5% |
| Czechs | 1.2 /100 | #248 | Tragic 13.5% |
| Spanish | 1.0 /100 | #249 | Tragic 13.6% |
| Immigrants | Somalia | 1.0 /100 | #250 | Tragic 13.6% |
| Immigrants | Zaire | 0.9 /100 | #251 | Tragic 13.6% |
| Finns | 0.9 /100 | #252 | Tragic 13.6% |
| German Russians | 0.8 /100 | #253 | Tragic 13.6% |
| Sub-Saharan Africans | 0.5 /100 | #254 | Tragic 13.7% |
| Spaniards | 0.4 /100 | #255 | Tragic 13.7% |
| Immigrants | Belize | 0.4 /100 | #256 | Tragic 13.7% |
| Immigrants | Central America | 0.3 /100 | #257 | Tragic 13.8% |