Iranian vs Cherokee Receiving Food Stamps
COMPARE
Iranian
Cherokee
Receiving Food Stamps
Receiving Food Stamps Comparison
Iranians
Cherokee
7.9%
RECEIVING FOOD STAMPS
100.0/ 100
METRIC RATING
4th/ 347
METRIC RANK
13.2%
RECEIVING FOOD STAMPS
2.5/ 100
METRIC RATING
233rd/ 347
METRIC RANK
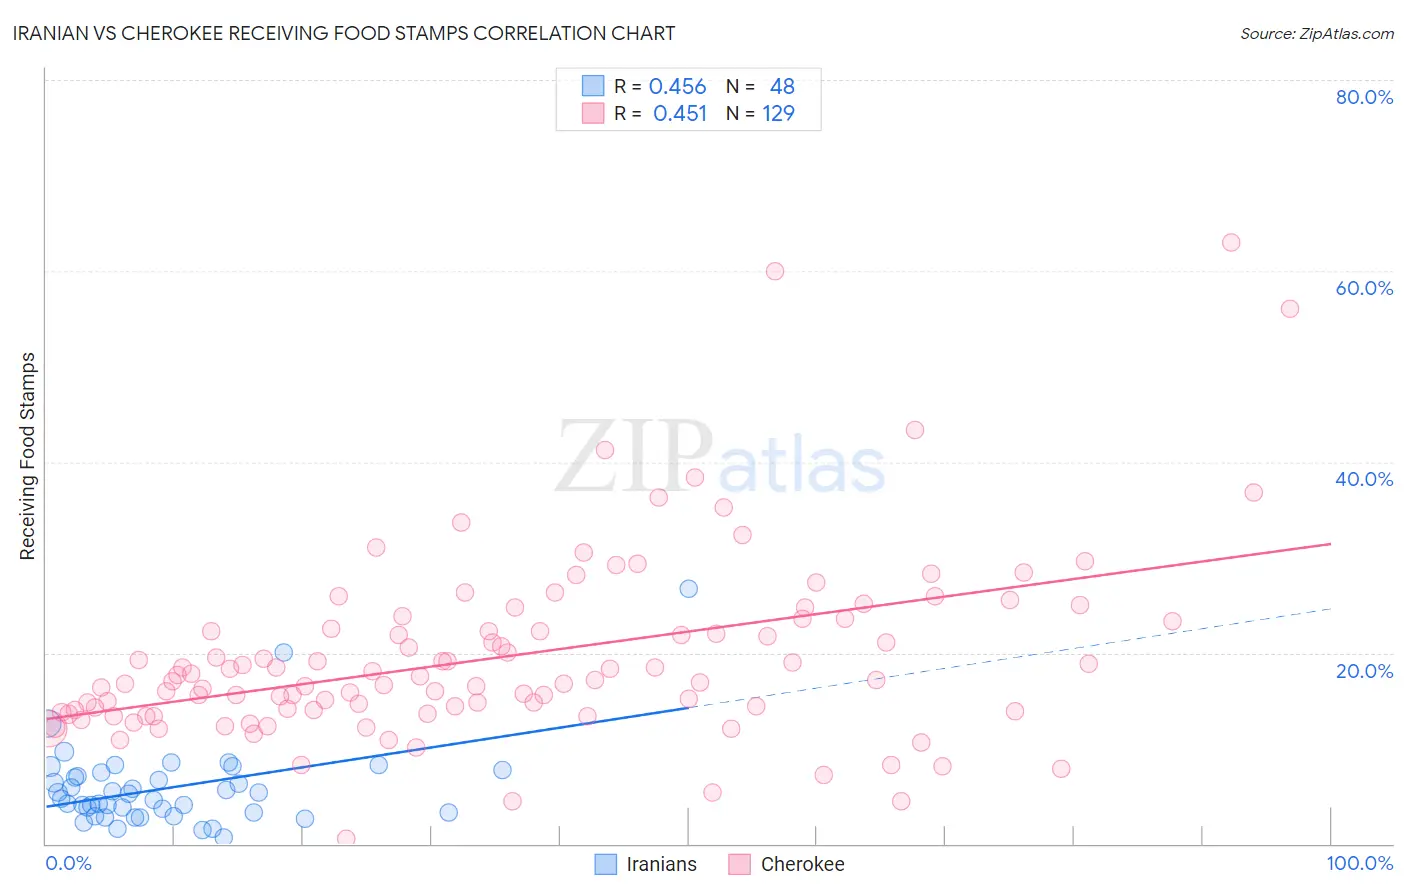
Iranian vs Cherokee Receiving Food Stamps Correlation Chart
The statistical analysis conducted on geographies consisting of 315,912,646 people shows a moderate positive correlation between the proportion of Iranians and percentage of population receiving government assistance and/or food stamps in the United States with a correlation coefficient (R) of 0.456 and weighted average of 7.9%. Similarly, the statistical analysis conducted on geographies consisting of 492,462,276 people shows a moderate positive correlation between the proportion of Cherokee and percentage of population receiving government assistance and/or food stamps in the United States with a correlation coefficient (R) of 0.451 and weighted average of 13.2%, a difference of 66.9%.
Receiving Food Stamps Correlation Summary
| Measurement | Iranian | Cherokee |
| Minimum | 0.70% | 0.50% |
| Maximum | 26.7% | 63.0% |
| Range | 26.0% | 62.5% |
| Mean | 5.9% | 19.6% |
| Median | 5.0% | 17.2% |
| Interquartile 25% (IQ1) | 3.3% | 14.0% |
| Interquartile 75% (IQ3) | 7.3% | 23.4% |
| Interquartile Range (IQR) | 4.0% | 9.4% |
| Standard Deviation (Sample) | 4.5% | 9.7% |
| Standard Deviation (Population) | 4.4% | 9.7% |
Similar Demographics by Receiving Food Stamps
Demographics Similar to Iranians by Receiving Food Stamps
In terms of receiving food stamps, the demographic groups most similar to Iranians are Thai (8.1%, a difference of 2.3%), Immigrants from Singapore (8.3%, a difference of 4.6%), Immigrants from Iran (8.3%, a difference of 5.2%), Filipino (7.4%, a difference of 7.3%), and Immigrants from India (7.4%, a difference of 7.6%).
| Demographics | Rating | Rank | Receiving Food Stamps |
| Immigrants | Taiwan | 100.0 /100 | #1 | Exceptional 7.3% |
| Immigrants | India | 100.0 /100 | #2 | Exceptional 7.4% |
| Filipinos | 100.0 /100 | #3 | Exceptional 7.4% |
| Iranians | 100.0 /100 | #4 | Exceptional 7.9% |
| Thais | 100.0 /100 | #5 | Exceptional 8.1% |
| Immigrants | Singapore | 100.0 /100 | #6 | Exceptional 8.3% |
| Immigrants | Iran | 100.0 /100 | #7 | Exceptional 8.3% |
| Burmese | 99.9 /100 | #8 | Exceptional 8.6% |
| Immigrants | Korea | 99.9 /100 | #9 | Exceptional 8.7% |
| Immigrants | South Central Asia | 99.9 /100 | #10 | Exceptional 8.8% |
| Okinawans | 99.9 /100 | #11 | Exceptional 8.9% |
| Cypriots | 99.9 /100 | #12 | Exceptional 8.9% |
| Bulgarians | 99.9 /100 | #13 | Exceptional 8.9% |
| Maltese | 99.9 /100 | #14 | Exceptional 8.9% |
| Norwegians | 99.9 /100 | #15 | Exceptional 9.0% |
Demographics Similar to Cherokee by Receiving Food Stamps
In terms of receiving food stamps, the demographic groups most similar to Cherokee are Comanche (13.3%, a difference of 0.13%), Salvadoran (13.2%, a difference of 0.26%), Immigrants from Zaire (13.4%, a difference of 0.90%), Immigrants from Nigeria (13.1%, a difference of 0.99%), and Puget Sound Salish (13.1%, a difference of 1.0%).
| Demographics | Rating | Rank | Receiving Food Stamps |
| Chickasaw | 3.6 /100 | #226 | Tragic 13.1% |
| Nigerians | 3.5 /100 | #227 | Tragic 13.1% |
| Panamanians | 3.5 /100 | #228 | Tragic 13.1% |
| Ottawa | 3.5 /100 | #229 | Tragic 13.1% |
| Puget Sound Salish | 3.4 /100 | #230 | Tragic 13.1% |
| Immigrants | Nigeria | 3.4 /100 | #231 | Tragic 13.1% |
| Salvadorans | 2.7 /100 | #232 | Tragic 13.2% |
| Cherokee | 2.5 /100 | #233 | Tragic 13.2% |
| Comanche | 2.4 /100 | #234 | Tragic 13.3% |
| Immigrants | Zaire | 1.9 /100 | #235 | Tragic 13.4% |
| Crow | 1.6 /100 | #236 | Tragic 13.4% |
| Immigrants | El Salvador | 1.5 /100 | #237 | Tragic 13.5% |
| French American Indians | 1.4 /100 | #238 | Tragic 13.5% |
| Immigrants | Micronesia | 1.3 /100 | #239 | Tragic 13.5% |
| Iroquois | 1.2 /100 | #240 | Tragic 13.5% |