Immigrants from Iran vs Shoshone Receiving Food Stamps
COMPARE
Immigrants from Iran
Shoshone
Receiving Food Stamps
Receiving Food Stamps Comparison
Immigrants from Iran
Shoshone
8.3%
RECEIVING FOOD STAMPS
100.0/ 100
METRIC RATING
7th/ 347
METRIC RANK
12.4%
RECEIVING FOOD STAMPS
17.7/ 100
METRIC RATING
203rd/ 347
METRIC RANK
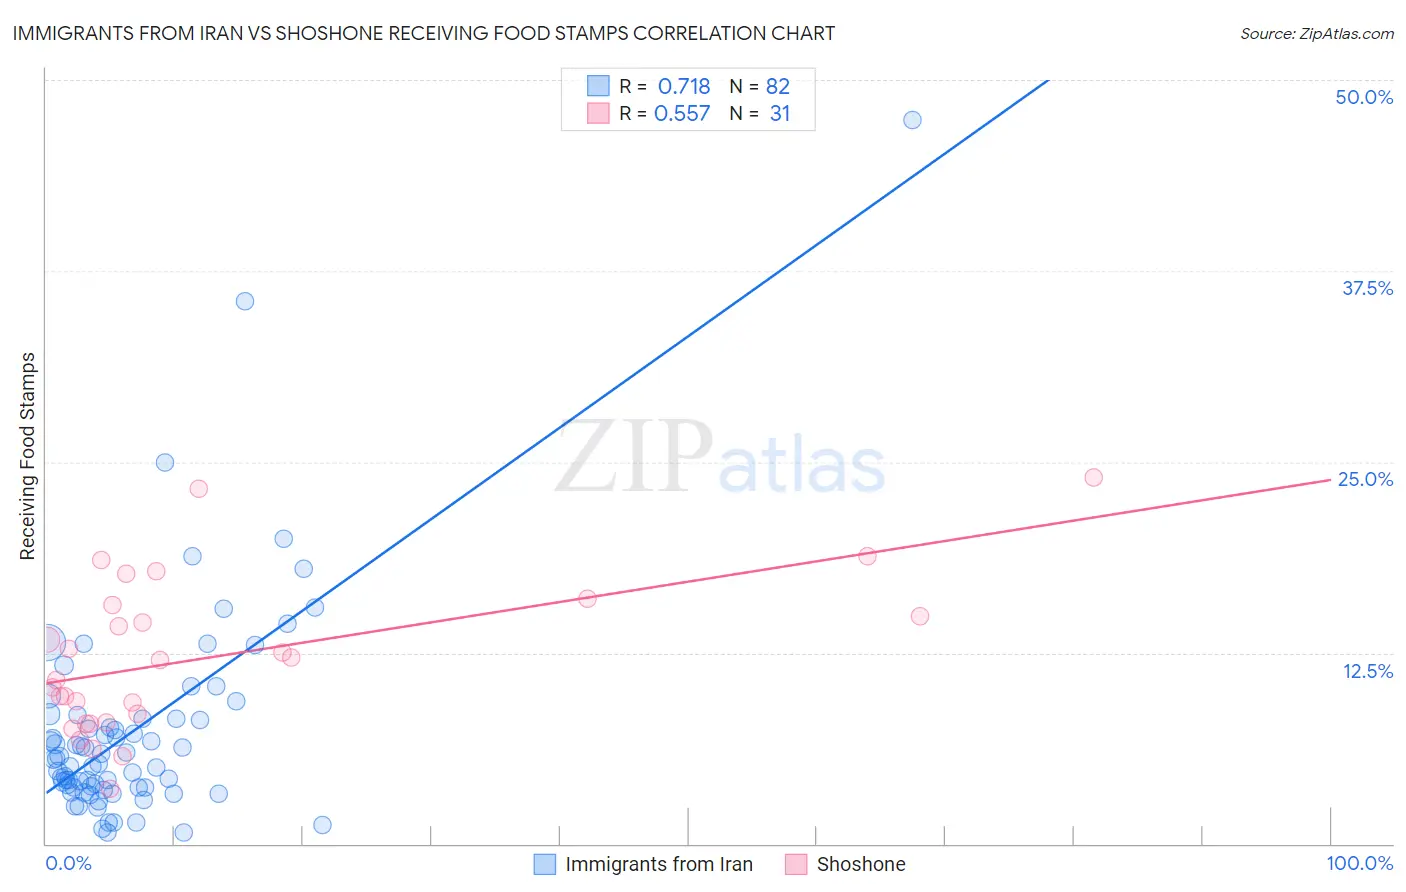
Immigrants from Iran vs Shoshone Receiving Food Stamps Correlation Chart
The statistical analysis conducted on geographies consisting of 279,188,122 people shows a strong positive correlation between the proportion of Immigrants from Iran and percentage of population receiving government assistance and/or food stamps in the United States with a correlation coefficient (R) of 0.718 and weighted average of 8.3%. Similarly, the statistical analysis conducted on geographies consisting of 66,597,434 people shows a substantial positive correlation between the proportion of Shoshone and percentage of population receiving government assistance and/or food stamps in the United States with a correlation coefficient (R) of 0.557 and weighted average of 12.4%, a difference of 48.2%.
Receiving Food Stamps Correlation Summary
| Measurement | Immigrants from Iran | Shoshone |
| Minimum | 0.70% | 3.6% |
| Maximum | 47.4% | 24.0% |
| Range | 46.7% | 20.4% |
| Mean | 7.5% | 12.2% |
| Median | 5.6% | 12.0% |
| Interquartile 25% (IQ1) | 3.7% | 7.9% |
| Interquartile 75% (IQ3) | 8.2% | 15.6% |
| Interquartile Range (IQR) | 4.5% | 7.7% |
| Standard Deviation (Sample) | 7.2% | 5.0% |
| Standard Deviation (Population) | 7.2% | 4.9% |
Similar Demographics by Receiving Food Stamps
Demographics Similar to Immigrants from Iran by Receiving Food Stamps
In terms of receiving food stamps, the demographic groups most similar to Immigrants from Iran are Immigrants from Singapore (8.3%, a difference of 0.56%), Thai (8.1%, a difference of 2.9%), Burmese (8.6%, a difference of 3.6%), Immigrants from Korea (8.7%, a difference of 3.8%), and Iranian (7.9%, a difference of 5.2%).
| Demographics | Rating | Rank | Receiving Food Stamps |
| Immigrants | Taiwan | 100.0 /100 | #1 | Exceptional 7.3% |
| Immigrants | India | 100.0 /100 | #2 | Exceptional 7.4% |
| Filipinos | 100.0 /100 | #3 | Exceptional 7.4% |
| Iranians | 100.0 /100 | #4 | Exceptional 7.9% |
| Thais | 100.0 /100 | #5 | Exceptional 8.1% |
| Immigrants | Singapore | 100.0 /100 | #6 | Exceptional 8.3% |
| Immigrants | Iran | 100.0 /100 | #7 | Exceptional 8.3% |
| Burmese | 99.9 /100 | #8 | Exceptional 8.6% |
| Immigrants | Korea | 99.9 /100 | #9 | Exceptional 8.7% |
| Immigrants | South Central Asia | 99.9 /100 | #10 | Exceptional 8.8% |
| Okinawans | 99.9 /100 | #11 | Exceptional 8.9% |
| Cypriots | 99.9 /100 | #12 | Exceptional 8.9% |
| Bulgarians | 99.9 /100 | #13 | Exceptional 8.9% |
| Maltese | 99.9 /100 | #14 | Exceptional 8.9% |
| Norwegians | 99.9 /100 | #15 | Exceptional 9.0% |
Demographics Similar to Shoshone by Receiving Food Stamps
In terms of receiving food stamps, the demographic groups most similar to Shoshone are Nonimmigrants (12.4%, a difference of 0.030%), Aleut (12.4%, a difference of 0.090%), Immigrants from Thailand (12.4%, a difference of 0.16%), South American (12.4%, a difference of 0.42%), and Immigrants from Venezuela (12.3%, a difference of 0.53%).
| Demographics | Rating | Rank | Receiving Food Stamps |
| Iraqis | 26.6 /100 | #196 | Fair 12.2% |
| Delaware | 26.1 /100 | #197 | Fair 12.2% |
| Immigrants | Costa Rica | 25.4 /100 | #198 | Fair 12.2% |
| Portuguese | 25.1 /100 | #199 | Fair 12.2% |
| Sierra Leoneans | 23.6 /100 | #200 | Fair 12.2% |
| Ugandans | 22.5 /100 | #201 | Fair 12.2% |
| Immigrants | Venezuela | 20.1 /100 | #202 | Fair 12.3% |
| Shoshone | 17.7 /100 | #203 | Poor 12.4% |
| Immigrants | Nonimmigrants | 17.6 /100 | #204 | Poor 12.4% |
| Aleuts | 17.3 /100 | #205 | Poor 12.4% |
| Immigrants | Thailand | 17.0 /100 | #206 | Poor 12.4% |
| South Americans | 16.0 /100 | #207 | Poor 12.4% |
| Potawatomi | 14.6 /100 | #208 | Poor 12.5% |
| Immigrants | Sierra Leone | 12.9 /100 | #209 | Poor 12.5% |
| Immigrants | Uruguay | 12.8 /100 | #210 | Poor 12.5% |