Iranian vs Immigrants from Malaysia Receiving Food Stamps
COMPARE
Iranian
Immigrants from Malaysia
Receiving Food Stamps
Receiving Food Stamps Comparison
Iranians
Immigrants from Malaysia
7.9%
RECEIVING FOOD STAMPS
100.0/ 100
METRIC RATING
4th/ 347
METRIC RANK
10.4%
RECEIVING FOOD STAMPS
96.5/ 100
METRIC RATING
105th/ 347
METRIC RANK
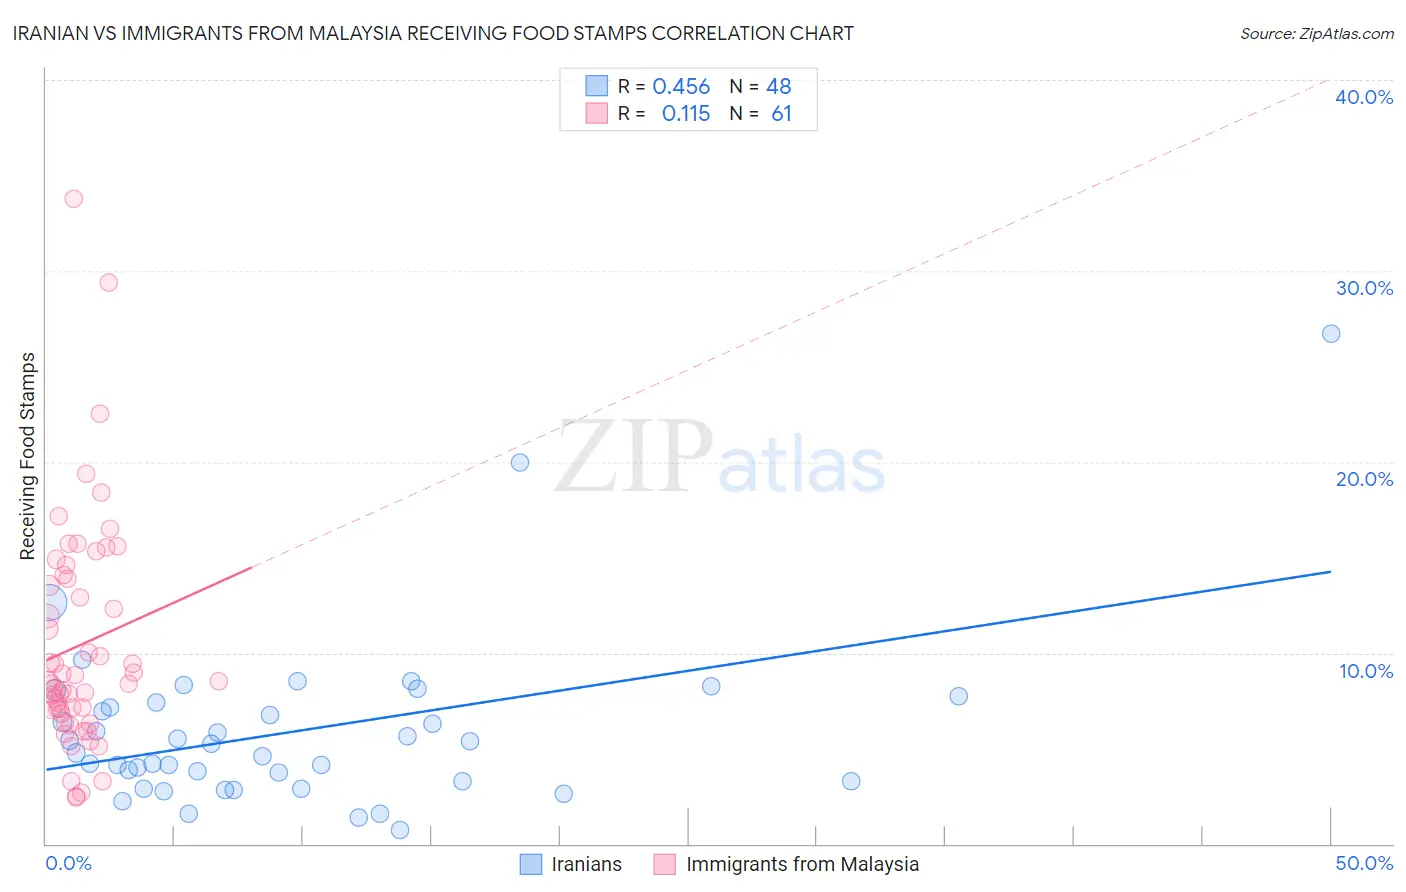
Iranian vs Immigrants from Malaysia Receiving Food Stamps Correlation Chart
The statistical analysis conducted on geographies consisting of 315,912,646 people shows a moderate positive correlation between the proportion of Iranians and percentage of population receiving government assistance and/or food stamps in the United States with a correlation coefficient (R) of 0.456 and weighted average of 7.9%. Similarly, the statistical analysis conducted on geographies consisting of 197,649,063 people shows a poor positive correlation between the proportion of Immigrants from Malaysia and percentage of population receiving government assistance and/or food stamps in the United States with a correlation coefficient (R) of 0.115 and weighted average of 10.4%, a difference of 30.8%.
Receiving Food Stamps Correlation Summary
| Measurement | Iranian | Immigrants from Malaysia |
| Minimum | 0.70% | 2.4% |
| Maximum | 26.7% | 33.8% |
| Range | 26.0% | 31.4% |
| Mean | 5.9% | 10.4% |
| Median | 5.0% | 8.5% |
| Interquartile 25% (IQ1) | 3.3% | 6.9% |
| Interquartile 75% (IQ3) | 7.3% | 14.0% |
| Interquartile Range (IQR) | 4.0% | 7.1% |
| Standard Deviation (Sample) | 4.5% | 6.0% |
| Standard Deviation (Population) | 4.4% | 5.9% |
Similar Demographics by Receiving Food Stamps
Demographics Similar to Iranians by Receiving Food Stamps
In terms of receiving food stamps, the demographic groups most similar to Iranians are Thai (8.1%, a difference of 2.3%), Immigrants from Singapore (8.3%, a difference of 4.6%), Immigrants from Iran (8.3%, a difference of 5.2%), Filipino (7.4%, a difference of 7.3%), and Immigrants from India (7.4%, a difference of 7.6%).
| Demographics | Rating | Rank | Receiving Food Stamps |
| Immigrants | Taiwan | 100.0 /100 | #1 | Exceptional 7.3% |
| Immigrants | India | 100.0 /100 | #2 | Exceptional 7.4% |
| Filipinos | 100.0 /100 | #3 | Exceptional 7.4% |
| Iranians | 100.0 /100 | #4 | Exceptional 7.9% |
| Thais | 100.0 /100 | #5 | Exceptional 8.1% |
| Immigrants | Singapore | 100.0 /100 | #6 | Exceptional 8.3% |
| Immigrants | Iran | 100.0 /100 | #7 | Exceptional 8.3% |
| Burmese | 99.9 /100 | #8 | Exceptional 8.6% |
| Immigrants | Korea | 99.9 /100 | #9 | Exceptional 8.7% |
| Immigrants | South Central Asia | 99.9 /100 | #10 | Exceptional 8.8% |
| Okinawans | 99.9 /100 | #11 | Exceptional 8.9% |
| Cypriots | 99.9 /100 | #12 | Exceptional 8.9% |
| Bulgarians | 99.9 /100 | #13 | Exceptional 8.9% |
| Maltese | 99.9 /100 | #14 | Exceptional 8.9% |
| Norwegians | 99.9 /100 | #15 | Exceptional 9.0% |
Demographics Similar to Immigrants from Malaysia by Receiving Food Stamps
In terms of receiving food stamps, the demographic groups most similar to Immigrants from Malaysia are Immigrants from Italy (10.4%, a difference of 0.090%), Korean (10.4%, a difference of 0.24%), Carpatho Rusyn (10.4%, a difference of 0.27%), Immigrants from Hungary (10.3%, a difference of 0.32%), and Immigrants from Pakistan (10.4%, a difference of 0.32%).
| Demographics | Rating | Rank | Receiving Food Stamps |
| Immigrants | Egypt | 97.1 /100 | #98 | Exceptional 10.3% |
| Serbians | 97.0 /100 | #99 | Exceptional 10.3% |
| Immigrants | Western Europe | 96.9 /100 | #100 | Exceptional 10.3% |
| Palestinians | 96.9 /100 | #101 | Exceptional 10.3% |
| Immigrants | Europe | 96.8 /100 | #102 | Exceptional 10.3% |
| Immigrants | Latvia | 96.8 /100 | #103 | Exceptional 10.3% |
| Immigrants | Hungary | 96.7 /100 | #104 | Exceptional 10.3% |
| Immigrants | Malaysia | 96.5 /100 | #105 | Exceptional 10.4% |
| Immigrants | Italy | 96.4 /100 | #106 | Exceptional 10.4% |
| Koreans | 96.3 /100 | #107 | Exceptional 10.4% |
| Carpatho Rusyns | 96.2 /100 | #108 | Exceptional 10.4% |
| Immigrants | Pakistan | 96.2 /100 | #109 | Exceptional 10.4% |
| Pakistanis | 95.9 /100 | #110 | Exceptional 10.4% |
| Romanians | 95.8 /100 | #111 | Exceptional 10.4% |
| Mongolians | 95.8 /100 | #112 | Exceptional 10.5% |