Immigrants from Zimbabwe vs Immigrants from Western Africa Female Poverty
COMPARE
Immigrants from Zimbabwe
Immigrants from Western Africa
Female Poverty
Female Poverty Comparison
Immigrants from Zimbabwe
Immigrants from Western Africa
12.6%
FEMALE POVERTY
93.1/ 100
METRIC RATING
109th/ 347
METRIC RANK
15.3%
FEMALE POVERTY
0.3/ 100
METRIC RATING
250th/ 347
METRIC RANK
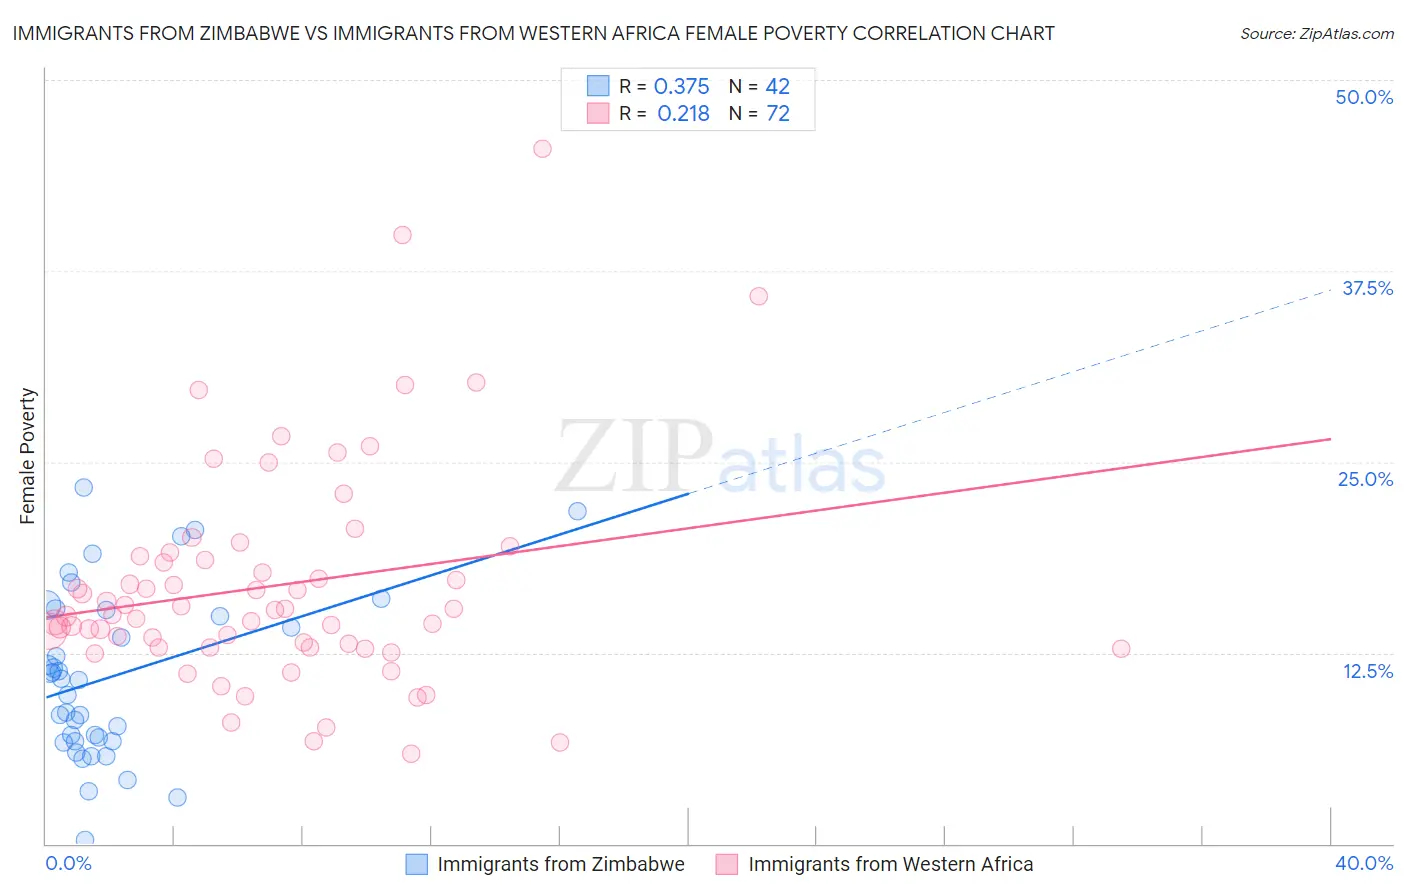
Immigrants from Zimbabwe vs Immigrants from Western Africa Female Poverty Correlation Chart
The statistical analysis conducted on geographies consisting of 117,784,385 people shows a mild positive correlation between the proportion of Immigrants from Zimbabwe and poverty level among females in the United States with a correlation coefficient (R) of 0.375 and weighted average of 12.6%. Similarly, the statistical analysis conducted on geographies consisting of 357,511,733 people shows a weak positive correlation between the proportion of Immigrants from Western Africa and poverty level among females in the United States with a correlation coefficient (R) of 0.218 and weighted average of 15.3%, a difference of 21.7%.
Female Poverty Correlation Summary
| Measurement | Immigrants from Zimbabwe | Immigrants from Western Africa |
| Minimum | 0.23% | 5.9% |
| Maximum | 23.3% | 45.5% |
| Range | 23.1% | 39.6% |
| Mean | 11.0% | 16.9% |
| Median | 10.8% | 15.1% |
| Interquartile 25% (IQ1) | 6.7% | 12.8% |
| Interquartile 75% (IQ3) | 15.3% | 18.7% |
| Interquartile Range (IQR) | 8.6% | 5.9% |
| Standard Deviation (Sample) | 5.5% | 7.3% |
| Standard Deviation (Population) | 5.4% | 7.2% |
Similar Demographics by Female Poverty
Demographics Similar to Immigrants from Zimbabwe by Female Poverty
In terms of female poverty, the demographic groups most similar to Immigrants from Zimbabwe are Portuguese (12.6%, a difference of 0.020%), Paraguayan (12.6%, a difference of 0.030%), Laotian (12.6%, a difference of 0.12%), Soviet Union (12.6%, a difference of 0.25%), and Immigrants from Turkey (12.6%, a difference of 0.31%).
| Demographics | Rating | Rank | Female Poverty |
| Immigrants | China | 94.5 /100 | #102 | Exceptional 12.5% |
| Slavs | 94.5 /100 | #103 | Exceptional 12.5% |
| Palestinians | 94.3 /100 | #104 | Exceptional 12.5% |
| Scottish | 94.1 /100 | #105 | Exceptional 12.5% |
| Immigrants | Turkey | 93.8 /100 | #106 | Exceptional 12.6% |
| Laotians | 93.4 /100 | #107 | Exceptional 12.6% |
| Portuguese | 93.1 /100 | #108 | Exceptional 12.6% |
| Immigrants | Zimbabwe | 93.1 /100 | #109 | Exceptional 12.6% |
| Paraguayans | 93.0 /100 | #110 | Exceptional 12.6% |
| Soviet Union | 92.4 /100 | #111 | Exceptional 12.6% |
| Immigrants | Israel | 92.0 /100 | #112 | Exceptional 12.6% |
| Canadians | 92.0 /100 | #113 | Exceptional 12.7% |
| Welsh | 91.6 /100 | #114 | Exceptional 12.7% |
| Puget Sound Salish | 91.5 /100 | #115 | Exceptional 12.7% |
| Immigrants | Russia | 91.2 /100 | #116 | Exceptional 12.7% |
Demographics Similar to Immigrants from Western Africa by Female Poverty
In terms of female poverty, the demographic groups most similar to Immigrants from Western Africa are Salvadoran (15.3%, a difference of 0.040%), Immigrants from Trinidad and Tobago (15.4%, a difference of 0.16%), Immigrants from Ghana (15.3%, a difference of 0.18%), Cuban (15.3%, a difference of 0.19%), and Potawatomi (15.3%, a difference of 0.19%).
| Demographics | Rating | Rank | Female Poverty |
| Nicaraguans | 0.3 /100 | #243 | Tragic 15.3% |
| Ecuadorians | 0.3 /100 | #244 | Tragic 15.3% |
| Spanish American Indians | 0.3 /100 | #245 | Tragic 15.3% |
| Cubans | 0.3 /100 | #246 | Tragic 15.3% |
| Potawatomi | 0.3 /100 | #247 | Tragic 15.3% |
| Immigrants | Ghana | 0.3 /100 | #248 | Tragic 15.3% |
| Salvadorans | 0.3 /100 | #249 | Tragic 15.3% |
| Immigrants | Western Africa | 0.3 /100 | #250 | Tragic 15.3% |
| Immigrants | Trinidad and Tobago | 0.3 /100 | #251 | Tragic 15.4% |
| Immigrants | Burma/Myanmar | 0.3 /100 | #252 | Tragic 15.4% |
| Liberians | 0.2 /100 | #253 | Tragic 15.4% |
| Trinidadians and Tobagonians | 0.2 /100 | #254 | Tragic 15.4% |
| Ottawa | 0.2 /100 | #255 | Tragic 15.5% |
| Jamaicans | 0.2 /100 | #256 | Tragic 15.5% |
| Immigrants | Jamaica | 0.1 /100 | #257 | Tragic 15.6% |