Immigrants from Zimbabwe vs Immigrants from Western Africa Family Households with Children
COMPARE
Immigrants from Zimbabwe
Immigrants from Western Africa
Family Households with Children
Family Households with Children Comparison
Immigrants from Zimbabwe
Immigrants from Western Africa
27.8%
FAMILY HOUSEHOLDS WITH CHILDREN
92.8/ 100
METRIC RATING
122nd/ 347
METRIC RANK
28.3%
FAMILY HOUSEHOLDS WITH CHILDREN
99.6/ 100
METRIC RATING
86th/ 347
METRIC RANK
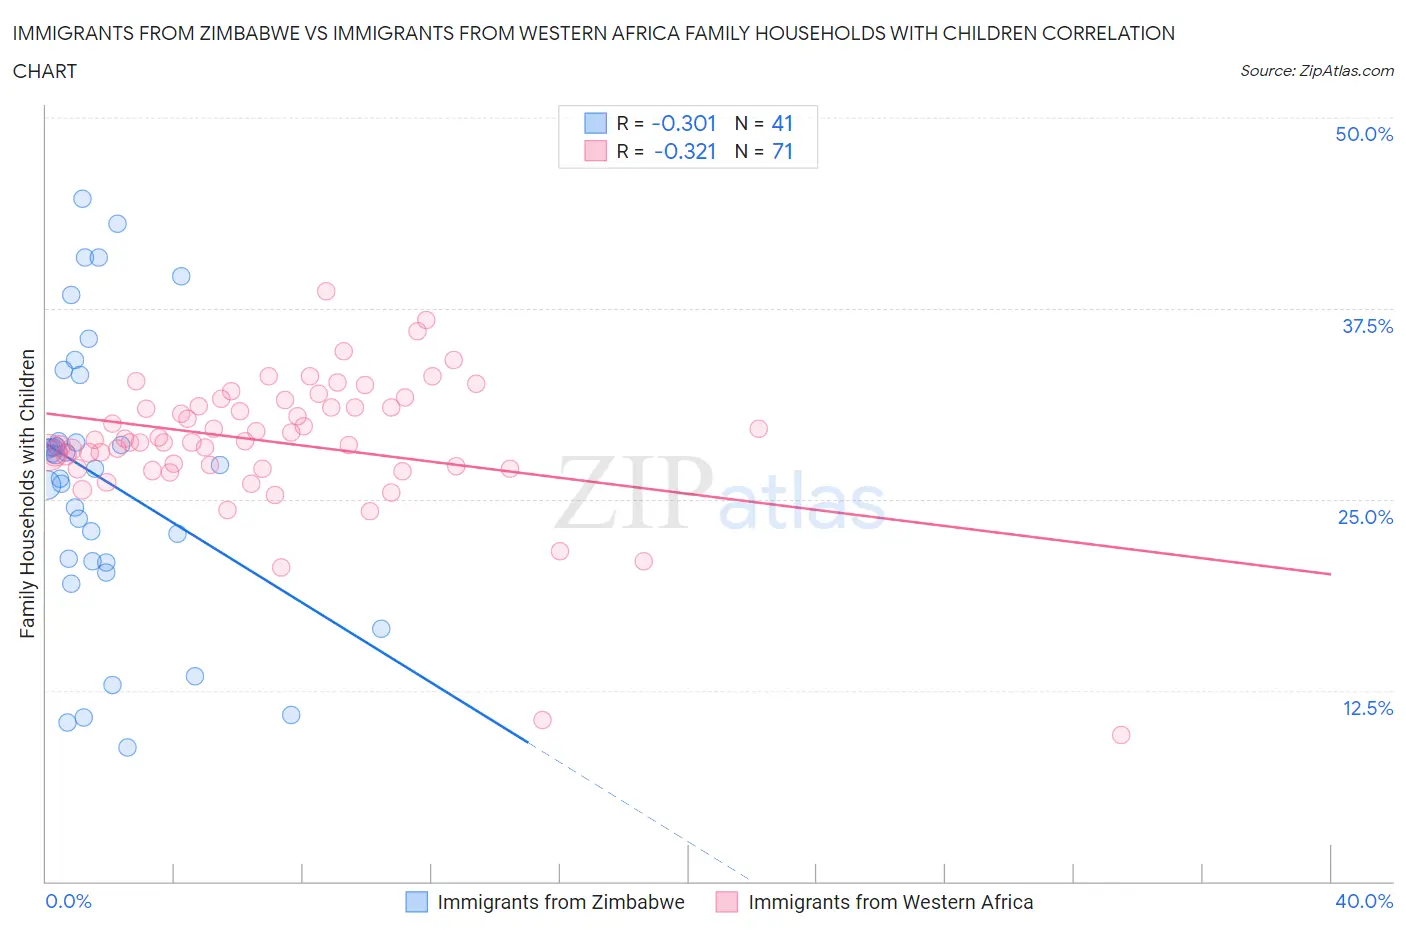
Immigrants from Zimbabwe vs Immigrants from Western Africa Family Households with Children Correlation Chart
The statistical analysis conducted on geographies consisting of 117,786,301 people shows a mild negative correlation between the proportion of Immigrants from Zimbabwe and percentage of family households with children in the United States with a correlation coefficient (R) of -0.301 and weighted average of 27.8%. Similarly, the statistical analysis conducted on geographies consisting of 357,382,055 people shows a mild negative correlation between the proportion of Immigrants from Western Africa and percentage of family households with children in the United States with a correlation coefficient (R) of -0.321 and weighted average of 28.3%, a difference of 1.7%.
Family Households with Children Correlation Summary
| Measurement | Immigrants from Zimbabwe | Immigrants from Western Africa |
| Minimum | 8.8% | 9.6% |
| Maximum | 44.7% | 38.6% |
| Range | 35.9% | 29.1% |
| Mean | 26.3% | 28.7% |
| Median | 27.3% | 28.8% |
| Interquartile 25% (IQ1) | 20.9% | 27.0% |
| Interquartile 75% (IQ3) | 31.0% | 31.1% |
| Interquartile Range (IQR) | 10.1% | 4.1% |
| Standard Deviation (Sample) | 9.1% | 4.6% |
| Standard Deviation (Population) | 9.0% | 4.6% |
Similar Demographics by Family Households with Children
Demographics Similar to Immigrants from Zimbabwe by Family Households with Children
In terms of family households with children, the demographic groups most similar to Immigrants from Zimbabwe are Immigrants from Western Asia (27.9%, a difference of 0.070%), Immigrants from Northern Africa (27.8%, a difference of 0.070%), Immigrants from Singapore (27.8%, a difference of 0.14%), Ecuadorian (27.8%, a difference of 0.14%), and Immigrants from Ethiopia (27.8%, a difference of 0.16%).
| Demographics | Rating | Rank | Family Households with Children |
| Immigrants | Africa | 96.8 /100 | #115 | Exceptional 28.0% |
| Pakistanis | 96.0 /100 | #116 | Exceptional 27.9% |
| Immigrants | Malaysia | 95.9 /100 | #117 | Exceptional 27.9% |
| Central American Indians | 95.9 /100 | #118 | Exceptional 27.9% |
| Zimbabweans | 95.6 /100 | #119 | Exceptional 27.9% |
| Europeans | 95.4 /100 | #120 | Exceptional 27.9% |
| Immigrants | Western Asia | 93.6 /100 | #121 | Exceptional 27.9% |
| Immigrants | Zimbabwe | 92.8 /100 | #122 | Exceptional 27.8% |
| Immigrants | Northern Africa | 91.8 /100 | #123 | Exceptional 27.8% |
| Immigrants | Singapore | 90.8 /100 | #124 | Exceptional 27.8% |
| Ecuadorians | 90.8 /100 | #125 | Exceptional 27.8% |
| Immigrants | Ethiopia | 90.5 /100 | #126 | Exceptional 27.8% |
| Belizeans | 90.0 /100 | #127 | Exceptional 27.8% |
| Syrians | 89.7 /100 | #128 | Excellent 27.8% |
| Immigrants | Eritrea | 89.4 /100 | #129 | Excellent 27.8% |
Demographics Similar to Immigrants from Western Africa by Family Households with Children
In terms of family households with children, the demographic groups most similar to Immigrants from Western Africa are Colombian (28.3%, a difference of 0.060%), Liberian (28.3%, a difference of 0.070%), Immigrants from Costa Rica (28.3%, a difference of 0.080%), Immigrants from Thailand (28.2%, a difference of 0.18%), and Immigrants from Liberia (28.2%, a difference of 0.23%).
| Demographics | Rating | Rank | Family Households with Children |
| Immigrants | Iraq | 99.8 /100 | #79 | Exceptional 28.4% |
| Natives/Alaskans | 99.8 /100 | #80 | Exceptional 28.4% |
| South Americans | 99.8 /100 | #81 | Exceptional 28.4% |
| Kenyans | 99.8 /100 | #82 | Exceptional 28.4% |
| Nicaraguans | 99.8 /100 | #83 | Exceptional 28.4% |
| Costa Ricans | 99.8 /100 | #84 | Exceptional 28.4% |
| Immigrants | Syria | 99.8 /100 | #85 | Exceptional 28.4% |
| Immigrants | Western Africa | 99.6 /100 | #86 | Exceptional 28.3% |
| Colombians | 99.6 /100 | #87 | Exceptional 28.3% |
| Liberians | 99.6 /100 | #88 | Exceptional 28.3% |
| Immigrants | Costa Rica | 99.6 /100 | #89 | Exceptional 28.3% |
| Immigrants | Thailand | 99.5 /100 | #90 | Exceptional 28.2% |
| Immigrants | Liberia | 99.4 /100 | #91 | Exceptional 28.2% |
| Chickasaw | 99.4 /100 | #92 | Exceptional 28.2% |
| Panamanians | 99.3 /100 | #93 | Exceptional 28.2% |