Bolivian vs Hispanic or Latino Male Poverty
COMPARE
Bolivian
Hispanic or Latino
Male Poverty
Male Poverty Comparison
Bolivians
Hispanics or Latinos
9.4%
MALE POVERTY
99.9/ 100
METRIC RATING
11th/ 347
METRIC RANK
13.9%
MALE POVERTY
0.0/ 100
METRIC RATING
294th/ 347
METRIC RANK
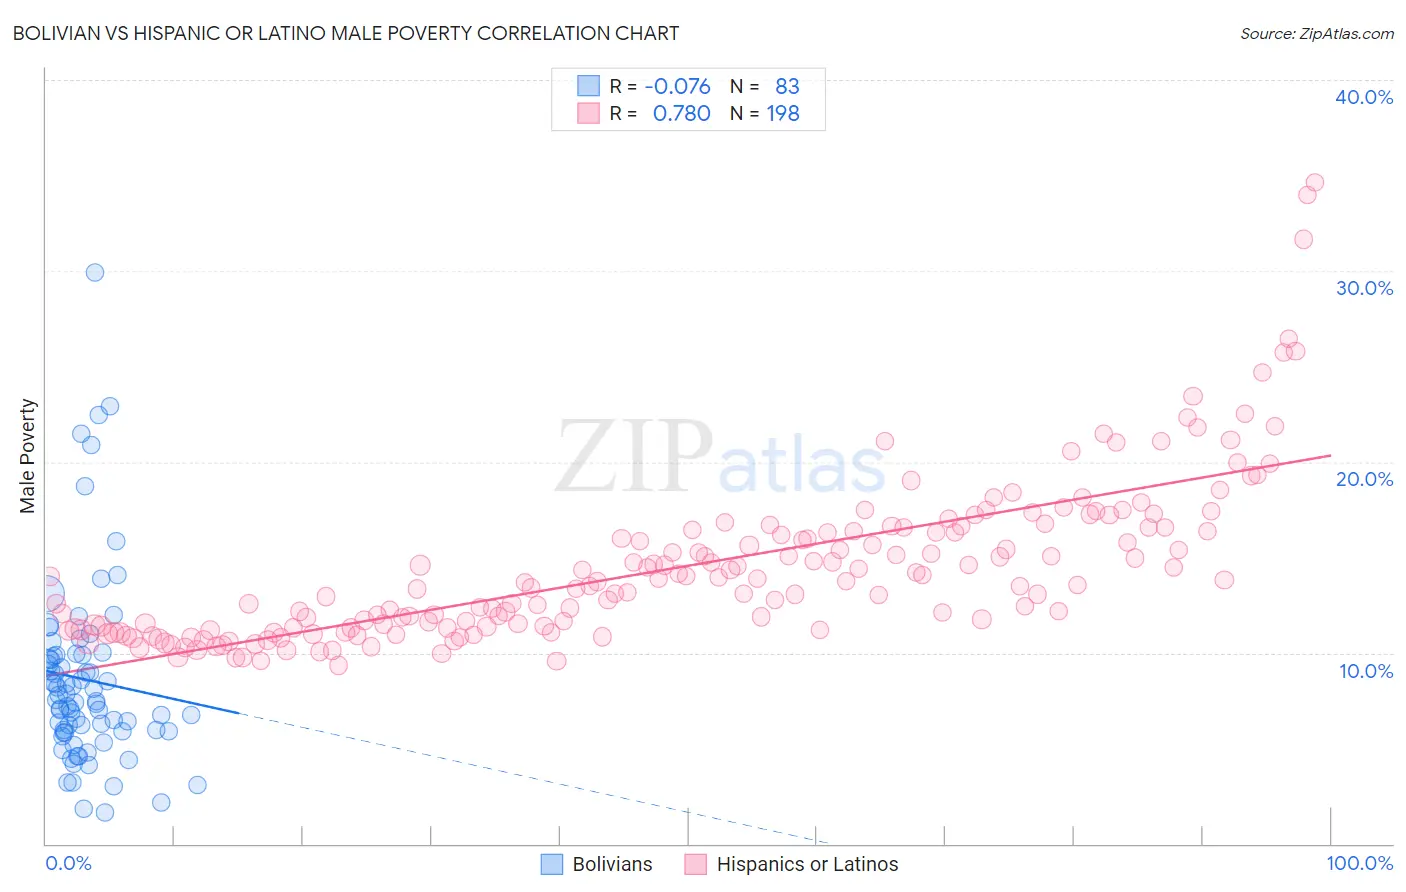
Bolivian vs Hispanic or Latino Male Poverty Correlation Chart
The statistical analysis conducted on geographies consisting of 184,589,682 people shows a slight negative correlation between the proportion of Bolivians and poverty level among males in the United States with a correlation coefficient (R) of -0.076 and weighted average of 9.4%. Similarly, the statistical analysis conducted on geographies consisting of 573,631,780 people shows a strong positive correlation between the proportion of Hispanics or Latinos and poverty level among males in the United States with a correlation coefficient (R) of 0.780 and weighted average of 13.9%, a difference of 47.6%.
Male Poverty Correlation Summary
| Measurement | Bolivian | Hispanic or Latino |
| Minimum | 1.7% | 9.3% |
| Maximum | 29.9% | 34.6% |
| Range | 28.3% | 25.3% |
| Mean | 8.6% | 14.5% |
| Median | 7.5% | 13.7% |
| Interquartile 25% (IQ1) | 5.9% | 11.3% |
| Interquartile 75% (IQ3) | 9.9% | 16.4% |
| Interquartile Range (IQR) | 4.0% | 5.1% |
| Standard Deviation (Sample) | 4.9% | 4.2% |
| Standard Deviation (Population) | 4.9% | 4.2% |
Similar Demographics by Male Poverty
Demographics Similar to Bolivians by Male Poverty
In terms of male poverty, the demographic groups most similar to Bolivians are Immigrants from Bolivia (9.4%, a difference of 0.050%), Immigrants from Lithuania (9.4%, a difference of 0.17%), Immigrants from North Macedonia (9.4%, a difference of 0.56%), Bulgarian (9.3%, a difference of 0.64%), and Bhutanese (9.5%, a difference of 0.85%).
| Demographics | Rating | Rank | Male Poverty |
| Immigrants | Taiwan | 100.0 /100 | #4 | Exceptional 8.9% |
| Maltese | 100.0 /100 | #5 | Exceptional 9.1% |
| Assyrians/Chaldeans/Syriacs | 99.9 /100 | #6 | Exceptional 9.1% |
| Immigrants | Ireland | 99.9 /100 | #7 | Exceptional 9.1% |
| Filipinos | 99.9 /100 | #8 | Exceptional 9.2% |
| Immigrants | South Central Asia | 99.9 /100 | #9 | Exceptional 9.3% |
| Bulgarians | 99.9 /100 | #10 | Exceptional 9.3% |
| Bolivians | 99.9 /100 | #11 | Exceptional 9.4% |
| Immigrants | Bolivia | 99.9 /100 | #12 | Exceptional 9.4% |
| Immigrants | Lithuania | 99.9 /100 | #13 | Exceptional 9.4% |
| Immigrants | North Macedonia | 99.8 /100 | #14 | Exceptional 9.4% |
| Bhutanese | 99.8 /100 | #15 | Exceptional 9.5% |
| Luxembourgers | 99.8 /100 | #16 | Exceptional 9.5% |
| Norwegians | 99.8 /100 | #17 | Exceptional 9.5% |
| Lithuanians | 99.8 /100 | #18 | Exceptional 9.5% |
Demographics Similar to Hispanics or Latinos by Male Poverty
In terms of male poverty, the demographic groups most similar to Hispanics or Latinos are Immigrants from Belize (13.8%, a difference of 0.060%), Indonesian (13.8%, a difference of 0.070%), Vietnamese (13.8%, a difference of 0.24%), Immigrants from Central America (13.9%, a difference of 0.28%), and Immigrants from Zaire (13.8%, a difference of 0.32%).
| Demographics | Rating | Rank | Male Poverty |
| Immigrants | Barbados | 0.0 /100 | #287 | Tragic 13.8% |
| Immigrants | St. Vincent and the Grenadines | 0.0 /100 | #288 | Tragic 13.8% |
| Guatemalans | 0.0 /100 | #289 | Tragic 13.8% |
| Immigrants | Zaire | 0.0 /100 | #290 | Tragic 13.8% |
| Vietnamese | 0.0 /100 | #291 | Tragic 13.8% |
| Indonesians | 0.0 /100 | #292 | Tragic 13.8% |
| Immigrants | Belize | 0.0 /100 | #293 | Tragic 13.8% |
| Hispanics or Latinos | 0.0 /100 | #294 | Tragic 13.9% |
| Immigrants | Central America | 0.0 /100 | #295 | Tragic 13.9% |
| Cajuns | 0.0 /100 | #296 | Tragic 13.9% |
| Inupiat | 0.0 /100 | #297 | Tragic 14.0% |
| Blackfeet | 0.0 /100 | #298 | Tragic 14.0% |
| Immigrants | Guatemala | 0.0 /100 | #299 | Tragic 14.0% |
| Immigrants | Mexico | 0.0 /100 | #300 | Tragic 14.0% |
| Immigrants | Senegal | 0.0 /100 | #301 | Tragic 14.0% |