Immigrants from Zaire vs Osage Female Poverty
COMPARE
Immigrants from Zaire
Osage
Female Poverty
Female Poverty Comparison
Immigrants from Zaire
Osage
16.4%
FEMALE POVERTY
0.0/ 100
METRIC RATING
292nd/ 347
METRIC RANK
14.8%
FEMALE POVERTY
1.5/ 100
METRIC RATING
232nd/ 347
METRIC RANK
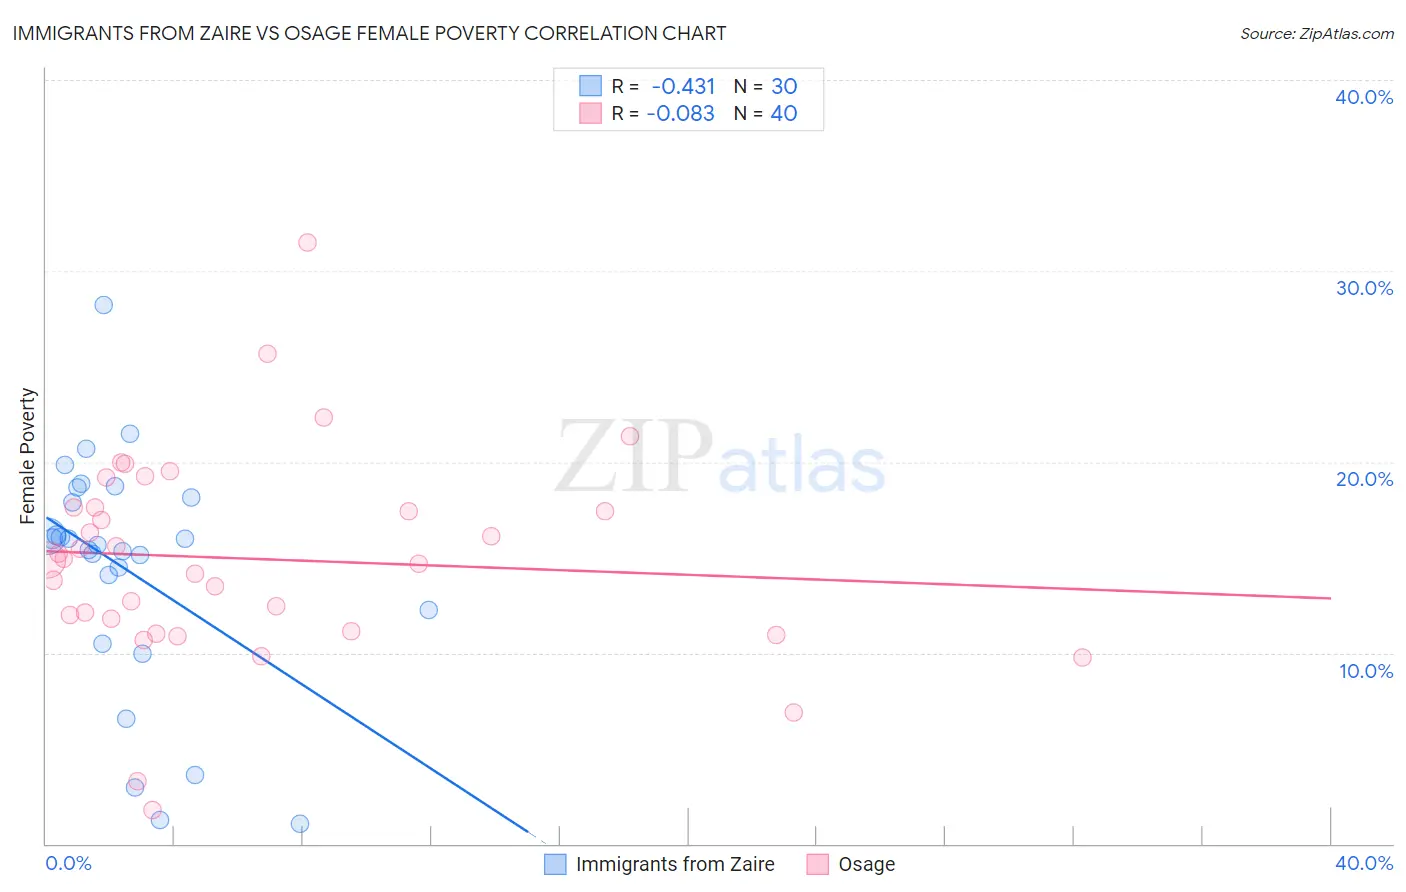
Immigrants from Zaire vs Osage Female Poverty Correlation Chart
The statistical analysis conducted on geographies consisting of 107,241,785 people shows a moderate negative correlation between the proportion of Immigrants from Zaire and poverty level among females in the United States with a correlation coefficient (R) of -0.431 and weighted average of 16.4%. Similarly, the statistical analysis conducted on geographies consisting of 91,795,919 people shows a slight negative correlation between the proportion of Osage and poverty level among females in the United States with a correlation coefficient (R) of -0.083 and weighted average of 14.8%, a difference of 11.0%.
Female Poverty Correlation Summary
| Measurement | Immigrants from Zaire | Osage |
| Minimum | 1.0% | 1.8% |
| Maximum | 28.2% | 31.5% |
| Range | 27.2% | 29.7% |
| Mean | 14.4% | 14.9% |
| Median | 15.8% | 14.9% |
| Interquartile 25% (IQ1) | 12.3% | 11.4% |
| Interquartile 75% (IQ3) | 18.2% | 17.6% |
| Interquartile Range (IQR) | 5.9% | 6.2% |
| Standard Deviation (Sample) | 6.2% | 5.5% |
| Standard Deviation (Population) | 6.1% | 5.4% |
Similar Demographics by Female Poverty
Demographics Similar to Immigrants from Zaire by Female Poverty
In terms of female poverty, the demographic groups most similar to Immigrants from Zaire are Yaqui (16.4%, a difference of 0.010%), Immigrants from Latin America (16.4%, a difference of 0.060%), Immigrants from Cabo Verde (16.4%, a difference of 0.090%), Senegalese (16.5%, a difference of 0.17%), and Immigrants from Bangladesh (16.4%, a difference of 0.18%).
| Demographics | Rating | Rank | Female Poverty |
| Comanche | 0.0 /100 | #285 | Tragic 16.2% |
| Inupiat | 0.0 /100 | #286 | Tragic 16.2% |
| Immigrants | Belize | 0.0 /100 | #287 | Tragic 16.3% |
| Indonesians | 0.0 /100 | #288 | Tragic 16.4% |
| Blackfeet | 0.0 /100 | #289 | Tragic 16.4% |
| Immigrants | Bangladesh | 0.0 /100 | #290 | Tragic 16.4% |
| Yaqui | 0.0 /100 | #291 | Tragic 16.4% |
| Immigrants | Zaire | 0.0 /100 | #292 | Tragic 16.4% |
| Immigrants | Latin America | 0.0 /100 | #293 | Tragic 16.4% |
| Immigrants | Cabo Verde | 0.0 /100 | #294 | Tragic 16.4% |
| Senegalese | 0.0 /100 | #295 | Tragic 16.5% |
| Immigrants | Senegal | 0.0 /100 | #296 | Tragic 16.5% |
| Mexicans | 0.0 /100 | #297 | Tragic 16.5% |
| Somalis | 0.0 /100 | #298 | Tragic 16.6% |
| Hispanics or Latinos | 0.0 /100 | #299 | Tragic 16.6% |
Demographics Similar to Osage by Female Poverty
In terms of female poverty, the demographic groups most similar to Osage are Immigrants from Saudi Arabia (14.8%, a difference of 0.10%), Nigerian (14.8%, a difference of 0.31%), Alaska Native (14.7%, a difference of 0.41%), Ghanaian (14.7%, a difference of 0.61%), and Fijian (14.9%, a difference of 0.62%).
| Demographics | Rating | Rank | Female Poverty |
| Immigrants | Micronesia | 2.8 /100 | #225 | Tragic 14.6% |
| Immigrants | Eritrea | 2.4 /100 | #226 | Tragic 14.6% |
| Immigrants | Nigeria | 2.1 /100 | #227 | Tragic 14.7% |
| German Russians | 2.0 /100 | #228 | Tragic 14.7% |
| Ghanaians | 1.9 /100 | #229 | Tragic 14.7% |
| Alaska Natives | 1.8 /100 | #230 | Tragic 14.7% |
| Nigerians | 1.7 /100 | #231 | Tragic 14.8% |
| Osage | 1.5 /100 | #232 | Tragic 14.8% |
| Immigrants | Saudi Arabia | 1.4 /100 | #233 | Tragic 14.8% |
| Fijians | 1.1 /100 | #234 | Tragic 14.9% |
| Immigrants | Laos | 0.9 /100 | #235 | Tragic 15.0% |
| Cree | 0.7 /100 | #236 | Tragic 15.1% |
| French American Indians | 0.6 /100 | #237 | Tragic 15.1% |
| Immigrants | Armenia | 0.6 /100 | #238 | Tragic 15.1% |
| Immigrants | Middle Africa | 0.5 /100 | #239 | Tragic 15.2% |