Immigrants from Uzbekistan vs Czechoslovakian Single Male Poverty
COMPARE
Immigrants from Uzbekistan
Czechoslovakian
Single Male Poverty
Single Male Poverty Comparison
Immigrants from Uzbekistan
Czechoslovakians
11.7%
SINGLE MALE POVERTY
99.9/ 100
METRIC RATING
54th/ 347
METRIC RANK
13.4%
SINGLE MALE POVERTY
3.0/ 100
METRIC RATING
239th/ 347
METRIC RANK
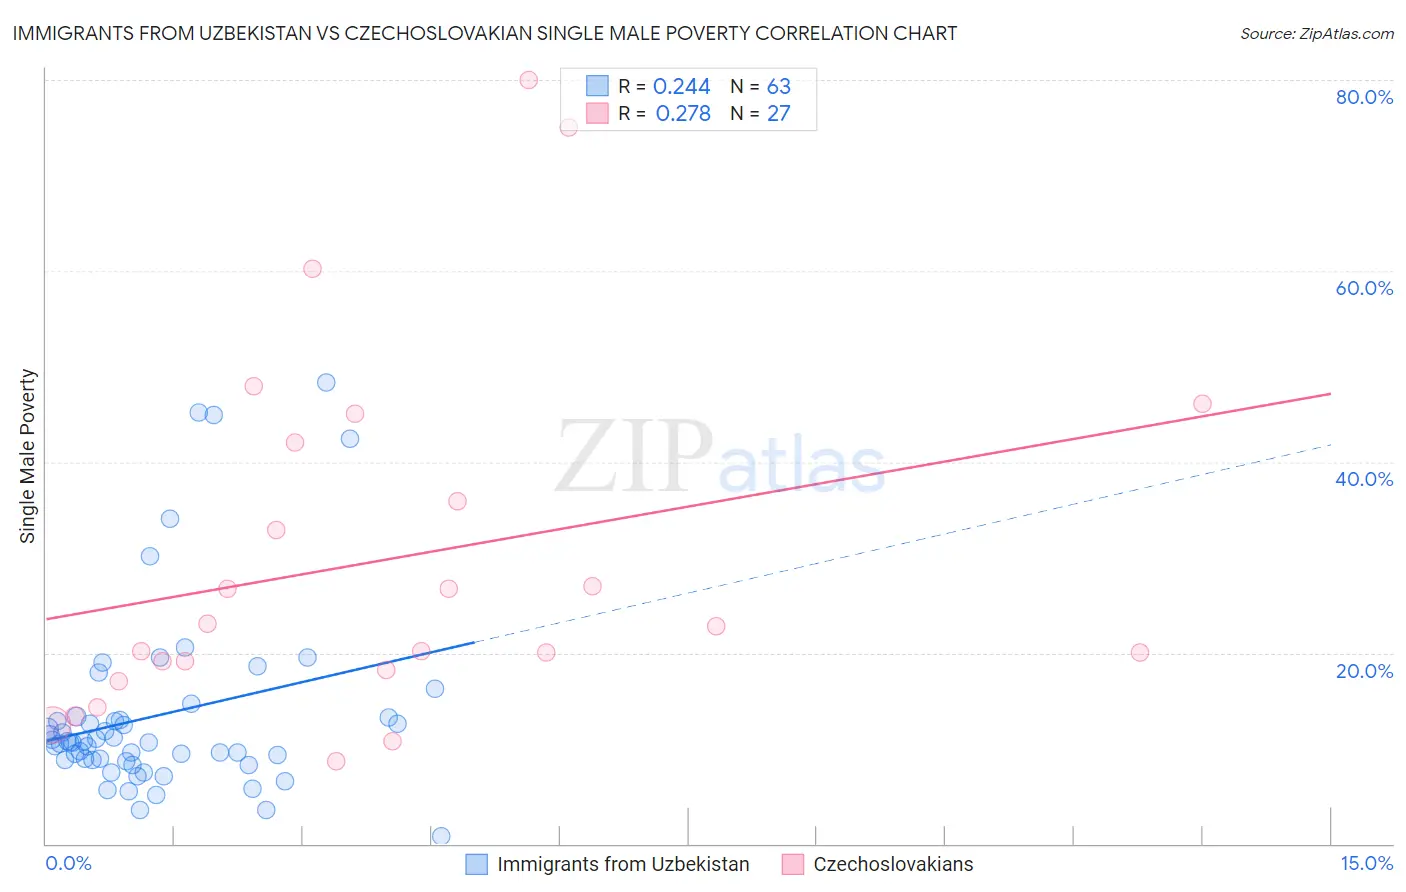
Immigrants from Uzbekistan vs Czechoslovakian Single Male Poverty Correlation Chart
The statistical analysis conducted on geographies consisting of 112,516,380 people shows a weak positive correlation between the proportion of Immigrants from Uzbekistan and poverty level among single males in the United States with a correlation coefficient (R) of 0.244 and weighted average of 11.7%. Similarly, the statistical analysis conducted on geographies consisting of 321,828,483 people shows a weak positive correlation between the proportion of Czechoslovakians and poverty level among single males in the United States with a correlation coefficient (R) of 0.278 and weighted average of 13.4%, a difference of 14.7%.
Single Male Poverty Correlation Summary
| Measurement | Immigrants from Uzbekistan | Czechoslovakian |
| Minimum | 0.78% | 8.6% |
| Maximum | 48.3% | 80.0% |
| Range | 47.5% | 71.4% |
| Mean | 13.5% | 29.8% |
| Median | 10.7% | 22.7% |
| Interquartile 25% (IQ1) | 8.7% | 18.2% |
| Interquartile 75% (IQ3) | 13.3% | 42.1% |
| Interquartile Range (IQR) | 4.5% | 23.9% |
| Standard Deviation (Sample) | 9.9% | 18.8% |
| Standard Deviation (Population) | 9.9% | 18.4% |
Similar Demographics by Single Male Poverty
Demographics Similar to Immigrants from Uzbekistan by Single Male Poverty
In terms of single male poverty, the demographic groups most similar to Immigrants from Uzbekistan are Bulgarian (11.7%, a difference of 0.020%), Samoan (11.7%, a difference of 0.12%), Cypriot (11.7%, a difference of 0.17%), Paraguayan (11.6%, a difference of 0.43%), and Burmese (11.7%, a difference of 0.48%).
| Demographics | Rating | Rank | Single Male Poverty |
| Nepalese | 99.9 /100 | #47 | Exceptional 11.6% |
| Immigrants | Indonesia | 99.9 /100 | #48 | Exceptional 11.6% |
| Tlingit-Haida | 99.9 /100 | #49 | Exceptional 11.6% |
| Immigrants | Lithuania | 99.9 /100 | #50 | Exceptional 11.6% |
| Paraguayans | 99.9 /100 | #51 | Exceptional 11.6% |
| Samoans | 99.9 /100 | #52 | Exceptional 11.7% |
| Bulgarians | 99.9 /100 | #53 | Exceptional 11.7% |
| Immigrants | Uzbekistan | 99.9 /100 | #54 | Exceptional 11.7% |
| Cypriots | 99.9 /100 | #55 | Exceptional 11.7% |
| Burmese | 99.8 /100 | #56 | Exceptional 11.7% |
| Immigrants | Romania | 99.8 /100 | #57 | Exceptional 11.7% |
| Immigrants | Brazil | 99.8 /100 | #58 | Exceptional 11.7% |
| Brazilians | 99.8 /100 | #59 | Exceptional 11.8% |
| Peruvians | 99.8 /100 | #60 | Exceptional 11.8% |
| Cambodians | 99.8 /100 | #61 | Exceptional 11.8% |
Demographics Similar to Czechoslovakians by Single Male Poverty
In terms of single male poverty, the demographic groups most similar to Czechoslovakians are Immigrants from Ghana (13.4%, a difference of 0.080%), British West Indian (13.4%, a difference of 0.18%), Luxembourger (13.4%, a difference of 0.24%), Bangladeshi (13.3%, a difference of 0.29%), and Belizean (13.4%, a difference of 0.30%).
| Demographics | Rating | Rank | Single Male Poverty |
| Immigrants | Caribbean | 5.0 /100 | #232 | Tragic 13.3% |
| British | 4.0 /100 | #233 | Tragic 13.3% |
| Canadians | 4.0 /100 | #234 | Tragic 13.3% |
| Bangladeshis | 3.7 /100 | #235 | Tragic 13.3% |
| Luxembourgers | 3.6 /100 | #236 | Tragic 13.4% |
| British West Indians | 3.4 /100 | #237 | Tragic 13.4% |
| Immigrants | Ghana | 3.2 /100 | #238 | Tragic 13.4% |
| Czechoslovakians | 3.0 /100 | #239 | Tragic 13.4% |
| Belizeans | 2.3 /100 | #240 | Tragic 13.4% |
| Immigrants | Germany | 2.1 /100 | #241 | Tragic 13.4% |
| Carpatho Rusyns | 2.1 /100 | #242 | Tragic 13.4% |
| Barbadians | 2.1 /100 | #243 | Tragic 13.4% |
| Immigrants | Senegal | 1.7 /100 | #244 | Tragic 13.5% |
| Immigrants | Latin America | 1.3 /100 | #245 | Tragic 13.5% |
| Immigrants | Micronesia | 1.2 /100 | #246 | Tragic 13.5% |