Immigrants from Yemen vs Yaqui Male Poverty
COMPARE
Immigrants from Yemen
Yaqui
Male Poverty
Male Poverty Comparison
Immigrants from Yemen
Yaqui
20.1%
MALE POVERTY
0.0/ 100
METRIC RATING
340th/ 347
METRIC RANK
13.7%
MALE POVERTY
0.0/ 100
METRIC RATING
281st/ 347
METRIC RANK
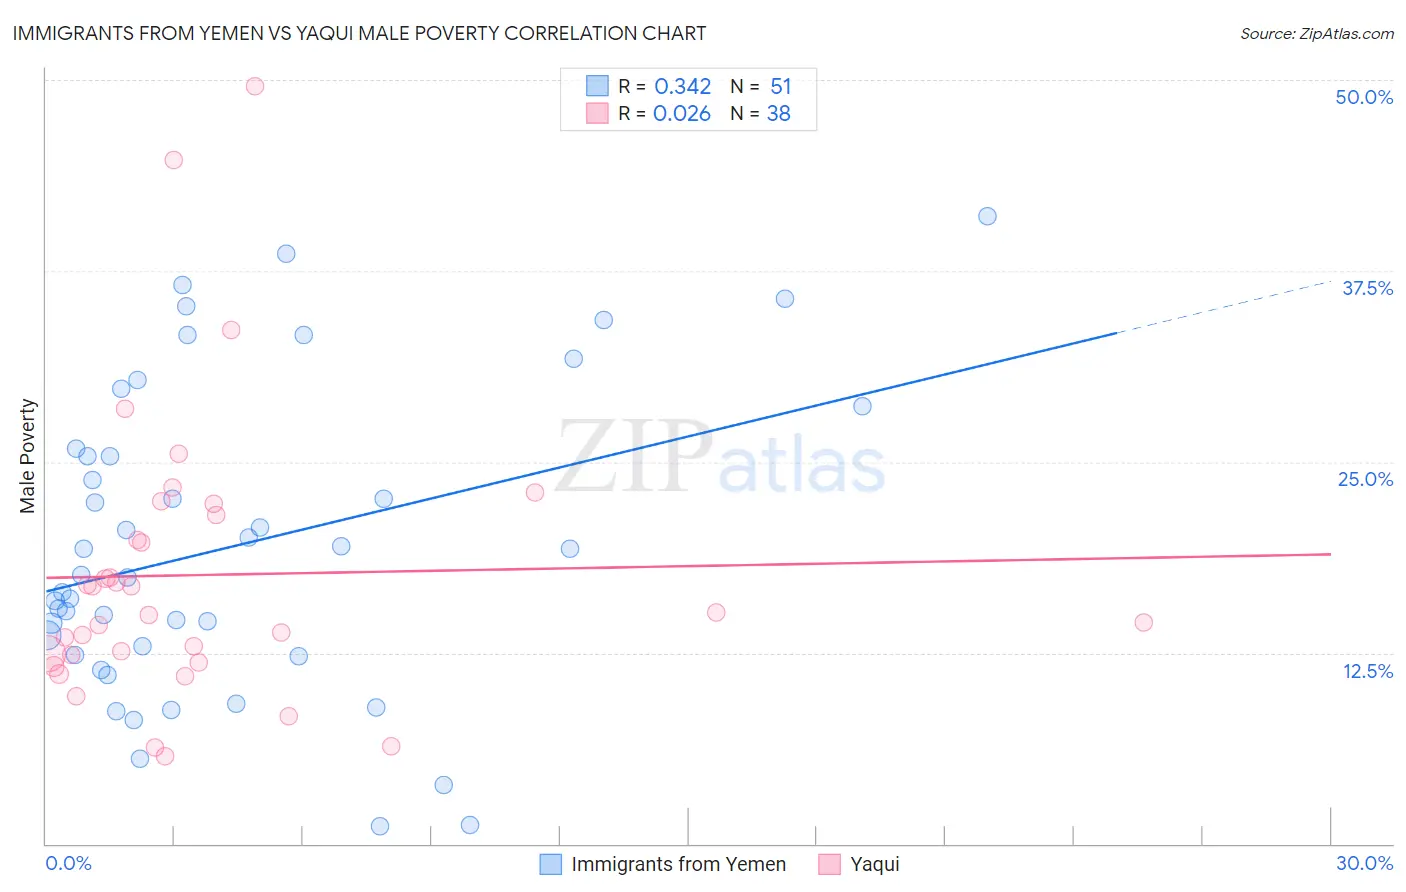
Immigrants from Yemen vs Yaqui Male Poverty Correlation Chart
The statistical analysis conducted on geographies consisting of 82,433,611 people shows a mild positive correlation between the proportion of Immigrants from Yemen and poverty level among males in the United States with a correlation coefficient (R) of 0.342 and weighted average of 20.1%. Similarly, the statistical analysis conducted on geographies consisting of 107,706,572 people shows no correlation between the proportion of Yaqui and poverty level among males in the United States with a correlation coefficient (R) of 0.026 and weighted average of 13.7%, a difference of 47.2%.
Male Poverty Correlation Summary
| Measurement | Immigrants from Yemen | Yaqui |
| Minimum | 1.1% | 5.7% |
| Maximum | 41.1% | 49.6% |
| Range | 40.0% | 43.9% |
| Mean | 19.6% | 17.6% |
| Median | 17.6% | 15.0% |
| Interquartile 25% (IQ1) | 12.4% | 12.4% |
| Interquartile 75% (IQ3) | 25.9% | 21.5% |
| Interquartile Range (IQR) | 13.5% | 9.1% |
| Standard Deviation (Sample) | 10.0% | 9.3% |
| Standard Deviation (Population) | 9.9% | 9.2% |
Similar Demographics by Male Poverty
Demographics Similar to Immigrants from Yemen by Male Poverty
In terms of male poverty, the demographic groups most similar to Immigrants from Yemen are Lumbee (20.2%, a difference of 0.30%), Pima (20.4%, a difference of 1.1%), Yup'ik (20.4%, a difference of 1.2%), Yuman (19.5%, a difference of 3.1%), and Hopi (20.8%, a difference of 3.3%).
| Demographics | Rating | Rank | Male Poverty |
| Natives/Alaskans | 0.0 /100 | #333 | Tragic 16.9% |
| Cheyenne | 0.0 /100 | #334 | Tragic 17.6% |
| Apache | 0.0 /100 | #335 | Tragic 17.7% |
| Pueblo | 0.0 /100 | #336 | Tragic 18.5% |
| Sioux | 0.0 /100 | #337 | Tragic 18.7% |
| Crow | 0.0 /100 | #338 | Tragic 19.1% |
| Yuman | 0.0 /100 | #339 | Tragic 19.5% |
| Immigrants | Yemen | 0.0 /100 | #340 | Tragic 20.1% |
| Lumbee | 0.0 /100 | #341 | Tragic 20.2% |
| Pima | 0.0 /100 | #342 | Tragic 20.4% |
| Yup'ik | 0.0 /100 | #343 | Tragic 20.4% |
| Hopi | 0.0 /100 | #344 | Tragic 20.8% |
| Puerto Ricans | 0.0 /100 | #345 | Tragic 22.0% |
| Navajo | 0.0 /100 | #346 | Tragic 22.3% |
| Tohono O'odham | 0.0 /100 | #347 | Tragic 22.9% |
Demographics Similar to Yaqui by Male Poverty
In terms of male poverty, the demographic groups most similar to Yaqui are Mexican (13.7%, a difference of 0.050%), Haitian (13.7%, a difference of 0.14%), Immigrants from Cabo Verde (13.7%, a difference of 0.27%), Belizean (13.6%, a difference of 0.32%), and Bangladeshi (13.6%, a difference of 0.41%).
| Demographics | Rating | Rank | Male Poverty |
| Immigrants | West Indies | 0.0 /100 | #274 | Tragic 13.5% |
| Barbadians | 0.0 /100 | #275 | Tragic 13.6% |
| Immigrants | Latin America | 0.0 /100 | #276 | Tragic 13.6% |
| Bangladeshis | 0.0 /100 | #277 | Tragic 13.6% |
| Belizeans | 0.0 /100 | #278 | Tragic 13.6% |
| Haitians | 0.0 /100 | #279 | Tragic 13.7% |
| Mexicans | 0.0 /100 | #280 | Tragic 13.7% |
| Yaqui | 0.0 /100 | #281 | Tragic 13.7% |
| Immigrants | Cabo Verde | 0.0 /100 | #282 | Tragic 13.7% |
| Comanche | 0.0 /100 | #283 | Tragic 13.8% |
| Immigrants | Haiti | 0.0 /100 | #284 | Tragic 13.8% |
| West Indians | 0.0 /100 | #285 | Tragic 13.8% |
| Shoshone | 0.0 /100 | #286 | Tragic 13.8% |
| Immigrants | Barbados | 0.0 /100 | #287 | Tragic 13.8% |
| Immigrants | St. Vincent and the Grenadines | 0.0 /100 | #288 | Tragic 13.8% |