Immigrants from Yemen vs Yaqui Professional Degree

COMPARE

Immigrants from Yemen
Race
Ancestry
AfghanAfricanAlaska NativeAlaskan AthabascanAlbanianAleutAlsatianAmericanApacheArabArapahoArgentineanArmenianAssyrian/Chaldean/SyriacAustralianAustrianBahamianBangladeshiBarbadianBasqueBelgianBelizeanBermudanBhutaneseBlackfeetBolivianBrazilianBritishBritish West IndianBulgarianBurmeseCajunCambodianCanadianCape VerdeanCarpatho RusynCelticCentral AmericanCentral American IndianCherokeeCheyenneChickasawChileanChineseChippewaChoctawColombianColvilleComancheCosta RicanCreeCreekCroatianCrowCubanCypriotCzechCzechoslovakianDanishDelawareDominicanDutchDutch West IndianEastern EuropeanEcuadorianEgyptianEnglishEstonianEthiopianEuropeanFijianFilipinoFinnishFrenchFrench American IndianFrench CanadianGermanGerman RussianGhanaianGreekGuamanian/ChamorroGuatemalanGuyaneseHaitianHmongHonduranHopiHoumaHungarianIcelanderIndian (Asian)IndonesianInupiatIranianIraqiIrishIroquoisIsraeliItalianJamaicanJapaneseJordanianKenyanKiowaKoreanLaotianLatvianLebaneseLiberianLithuanianLumbeeLuxembourgerMacedonianMalaysianMalteseMarshalleseMenomineeMexicanMexican American IndianMongolianMoroccanNative HawaiianNavajoNepaleseNew ZealanderNicaraguanNigerianNorthern EuropeanNorwegianOkinawanOsageOttawaPaiutePakistaniPalestinianPanamanianParaguayanPennsylvania GermanPeruvianPimaPolishPortuguesePotawatomiPuebloPuerto RicanPuget Sound SalishRomanianRussianSalvadoranSamoanScandinavianScotch-IrishScottishSeminoleSenegaleseSerbianShoshoneSierra LeoneanSiouxSlavicSlovakSloveneSomaliSouth AfricanSouth AmericanSouth American IndianSoviet UnionSpaniardSpanishSpanish AmericanSpanish American IndianSri LankanSubsaharan AfricanSudaneseSwedishSwissSyrianTaiwaneseThaiTlingit-HaidaTohono O'OdhamTonganTrinidadian and TobagonianTsimshianTurkishU.S. Virgin IslanderUgandanUkrainianUruguayanUteVenezuelanVietnameseWelshWest IndianYakamaYugoslavianYumanYup'ikZimbabwean
Immigration
NonimmigrantsImmigrantsAfghanistanAfricaAlbaniaArgentinaArmeniaAsiaAustraliaAustriaBahamasBangladeshBarbadosBelarusBelgiumBelizeBoliviaBosnia and HerzegovinaBrazilBulgariaBurma/MyanmarCabo VerdeCambodiaCameroonCanadaCaribbeanCentral AmericaChileChinaColombiaCongoCosta RicaCroatiaCubaCzechoslovakiaDenmarkDominicaDominican RepublicEastern AfricaEastern AsiaEastern EuropeEcuadorEgyptEl SalvadorEnglandEritreaEthiopiaEuropeFijiFranceGermanyGhanaGreeceGrenadaGuatemalaGuyanaHaitiHondurasHong KongHungaryIndiaIndonesiaIranIraqIrelandIsraelItalyJamaicaJapanJordanKazakhstanKenyaKoreaKuwaitLaosLatin AmericaLatviaLebanonLiberiaLithuaniaMalaysiaMexicoMicronesiaMiddle AfricaMoldovaMoroccoNepalNetherlandsNicaraguaNigeriaNorth AmericaNorth MacedoniaNorthern AfricaNorthern EuropeNorwayOceaniaPakistanPanamaPeruPhilippinesPolandPortugalRomaniaRussiaSaudi ArabiaScotlandSenegalSerbiaSierra LeoneSingaporeSomaliaSouth AfricaSouth AmericaSouth Central AsiaSouth Eastern AsiaSouthern EuropeSpainSri LankaSt. Vincent and the GrenadinesSudanSwedenSwitzerlandSyriaTaiwanThailandTrinidad and TobagoTurkeyUgandaUkraineUruguayUzbekistanVenezuelaVietnamWest IndiesWestern AfricaWestern AsiaWestern EuropeYemenZaireZimbabweAzores
Yaqui
Race
Ancestry
AfghanAfricanAlaska NativeAlaskan AthabascanAlbanianAleutAlsatianAmericanApacheArabArapahoArgentineanArmenianAssyrian/Chaldean/SyriacAustralianAustrianBahamianBangladeshiBarbadianBasqueBelgianBelizeanBermudanBhutaneseBlackfeetBolivianBrazilianBritishBritish West IndianBulgarianBurmeseCajunCambodianCanadianCape VerdeanCarpatho RusynCelticCentral AmericanCentral American IndianCherokeeCheyenneChickasawChileanChineseChippewaChoctawColombianColvilleComancheCosta RicanCreeCreekCroatianCrowCubanCypriotCzechCzechoslovakianDanishDelawareDominicanDutchDutch West IndianEastern EuropeanEcuadorianEgyptianEnglishEstonianEthiopianEuropeanFijianFilipinoFinnishFrenchFrench American IndianFrench CanadianGermanGerman RussianGhanaianGreekGuamanian/ChamorroGuatemalanGuyaneseHaitianHmongHonduranHopiHoumaHungarianIcelanderIndian (Asian)IndonesianInupiatIranianIraqiIrishIroquoisIsraeliItalianJamaicanJapaneseJordanianKenyanKiowaKoreanLaotianLatvianLebaneseLiberianLithuanianLumbeeLuxembourgerMacedonianMalaysianMalteseMarshalleseMenomineeMexicanMexican American IndianMongolianMoroccanNative HawaiianNavajoNepaleseNew ZealanderNicaraguanNigerianNorthern EuropeanNorwegianOkinawanOsageOttawaPaiutePakistaniPalestinianPanamanianParaguayanPennsylvania GermanPeruvianPimaPolishPortuguesePotawatomiPuebloPuerto RicanPuget Sound SalishRomanianRussianSalvadoranSamoanScandinavianScotch-IrishScottishSeminoleSenegaleseSerbianShoshoneSierra LeoneanSiouxSlavicSlovakSloveneSomaliSouth AfricanSouth AmericanSouth American IndianSoviet UnionSpaniardSpanishSpanish AmericanSpanish American IndianSri LankanSubsaharan AfricanSudaneseSwedishSwissSyrianTaiwaneseThaiTlingit-HaidaTohono O'OdhamTonganTrinidadian and TobagonianTsimshianTurkishU.S. Virgin IslanderUgandanUkrainianUruguayanUteVenezuelanVietnameseWelshWest IndianYakamaYaquiYugoslavianYumanYup'ikZimbabwean
Immigration
NonimmigrantsImmigrantsAfghanistanAfricaAlbaniaArgentinaArmeniaAsiaAustraliaAustriaBahamasBangladeshBarbadosBelarusBelgiumBelizeBoliviaBosnia and HerzegovinaBrazilBulgariaBurma/MyanmarCabo VerdeCambodiaCameroonCanadaCaribbeanCentral AmericaChileChinaColombiaCongoCosta RicaCroatiaCubaCzechoslovakiaDenmarkDominicaDominican RepublicEastern AfricaEastern AsiaEastern EuropeEcuadorEgyptEl SalvadorEnglandEritreaEthiopiaEuropeFijiFranceGermanyGhanaGreeceGrenadaGuatemalaGuyanaHaitiHondurasHong KongHungaryIndiaIndonesiaIranIraqIrelandIsraelItalyJamaicaJapanJordanKazakhstanKenyaKoreaKuwaitLaosLatin AmericaLatviaLebanonLiberiaLithuaniaMalaysiaMexicoMicronesiaMiddle AfricaMoldovaMoroccoNepalNetherlandsNicaraguaNigeriaNorth AmericaNorth MacedoniaNorthern AfricaNorthern EuropeNorwayOceaniaPakistanPanamaPeruPhilippinesPolandPortugalRomaniaRussiaSaudi ArabiaScotlandSenegalSerbiaSierra LeoneSingaporeSomaliaSouth AfricaSouth AmericaSouth Central AsiaSouth Eastern AsiaSouthern EuropeSpainSri LankaSt. Vincent and the GrenadinesSudanSwedenSwitzerlandSyriaTaiwanThailandTrinidad and TobagoTurkeyUgandaUkraineUruguayUzbekistanVenezuelaVietnamWest IndiesWestern AfricaWestern AsiaWestern EuropeZaireZimbabweAzores
Professional Degree
Income
Poverty
Unemployment
Labor Participation
Family Structure
Vehicle Availability
Education Level
Disability

Professional Degree Comparison

Immigrants from Yemen

Yaqui

Tragic
Tragic
3.4%
PROFESSIONAL DEGREE
0.2/ 100
METRIC RATING
299th/ 347
METRIC RANK
3.2%
PROFESSIONAL DEGREE
0.0/ 100
METRIC RATING
325th/ 347
METRIC RANK

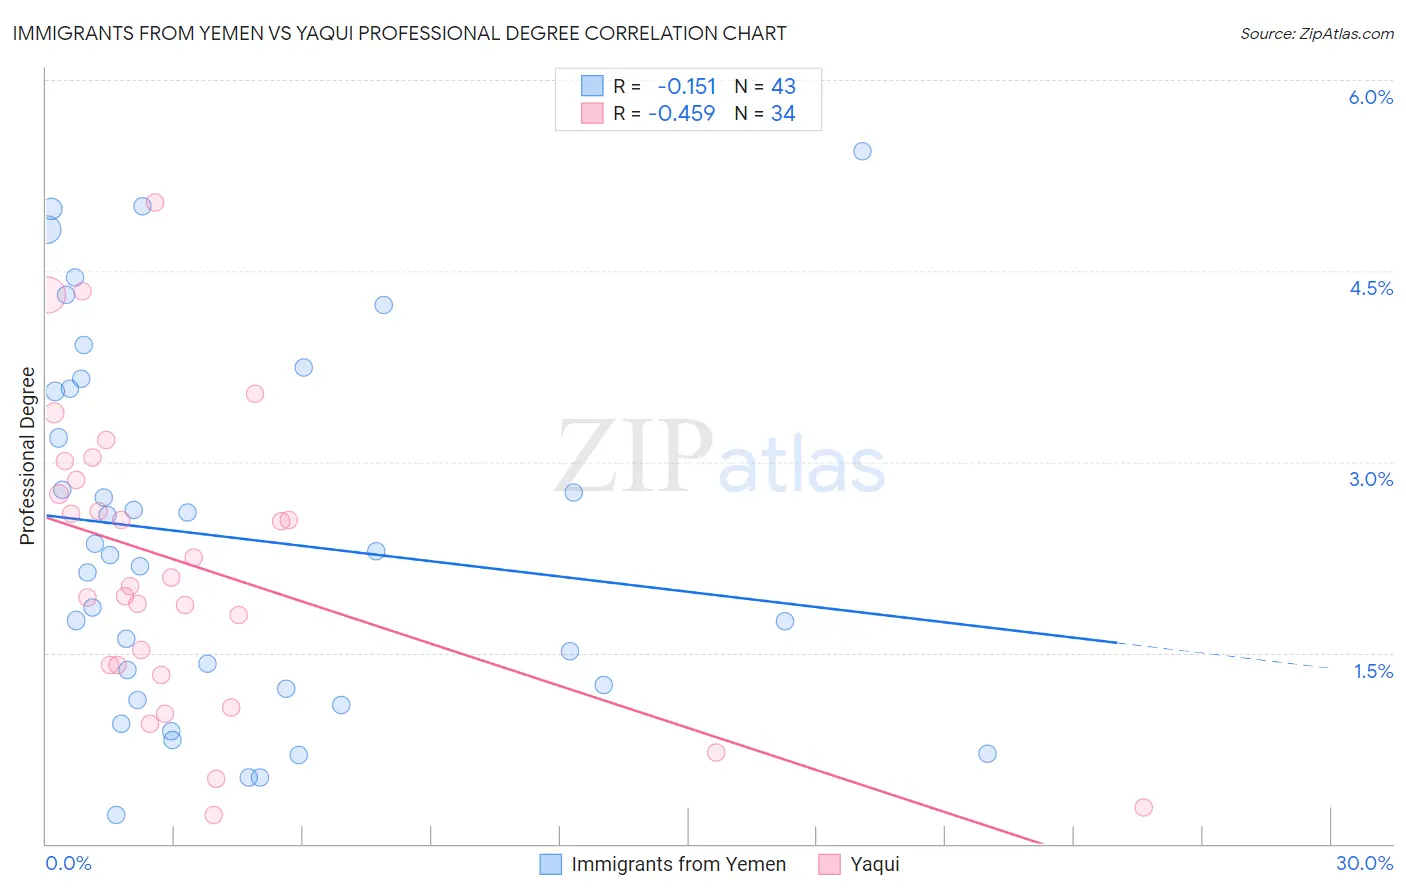
Immigrants from Yemen vs Yaqui Professional Degree Correlation Chart

The statistical analysis conducted on geographies consisting of 82,369,214 people shows a poor negative correlation between the proportion of Immigrants from Yemen and percentage of population with at least professional degree education in the United States with a correlation coefficient (R) of -0.151 and weighted average of 3.4%. Similarly, the statistical analysis conducted on geographies consisting of 107,544,559 people shows a moderate negative correlation between the proportion of Yaqui and percentage of population with at least professional degree education in the United States with a correlation coefficient (R) of -0.459 and weighted average of 3.2%, a difference of 7.9%.
Immigrants from Yemen vs Yaqui Professional Degree

Professional Degree Correlation Summary

MeasurementImmigrants from YemenYaqui
Minimum0.23%0.22%
Maximum5.4%5.0%
Range5.2%4.8%
Mean2.4%2.2%
Median2.3%2.1%
Interquartile 25% (IQ1)1.2%1.4%
Interquartile 75% (IQ3)3.6%2.9%
Interquartile Range (IQR)2.4%1.5%
Standard Deviation (Sample)1.4%1.2%
Standard Deviation (Population)1.4%1.1%

Similar Demographics by Professional Degree

Demographics Similar to Immigrants from Yemen by Professional Degree

In terms of professional degree, the demographic groups most similar to Immigrants from Yemen are Black/African American (3.4%, a difference of 0.13%), Immigrants from Dominican Republic (3.4%, a difference of 0.28%), Malaysian (3.4%, a difference of 0.38%), Ottawa (3.4%, a difference of 0.67%), and Immigrants from Liberia (3.4%, a difference of 0.72%).
DemographicsRating | RankProfessional Degree
Immigrants | Belize
0.3
/100
|
#292
Tragic
3.5%
Immigrants | Honduras
0.3
/100
|
#293
Tragic
3.5%
Paiute
0.3
/100
|
#294
Tragic
3.4%
Immigrants | Guatemala
0.2
/100
|
#295
Tragic
3.4%
Hawaiians
0.2
/100
|
#296
Tragic
3.4%
Immigrants | Liberia
0.2
/100
|
#297
Tragic
3.4%
Ottawa
0.2
/100
|
#298
Tragic
3.4%
Immigrants | Yemen
0.2
/100
|
#299
Tragic
3.4%
Blacks/African Americans
0.2
/100
|
#300
Tragic
3.4%
Immigrants | Dominican Republic
0.2
/100
|
#301
Tragic
3.4%
Malaysians
0.2
/100
|
#302
Tragic
3.4%
Immigrants | Haiti
0.2
/100
|
#303
Tragic
3.4%
Cajuns
0.2
/100
|
#304
Tragic
3.4%
Chickasaw
0.1
/100
|
#305
Tragic
3.4%
Cape Verdeans
0.1
/100
|
#306
Tragic
3.4%

Demographics Similar to Yaqui by Professional Degree

In terms of professional degree, the demographic groups most similar to Yaqui are Crow (3.2%, a difference of 0.060%), Inupiat (3.2%, a difference of 0.34%), Hispanic or Latino (3.2%, a difference of 0.42%), Tsimshian (3.2%, a difference of 0.78%), and Seminole (3.2%, a difference of 1.1%).
DemographicsRating | RankProfessional Degree
Immigrants | Micronesia
0.1
/100
|
#318
Tragic
3.2%
Choctaw
0.1
/100
|
#319
Tragic
3.2%
Seminole
0.1
/100
|
#320
Tragic
3.2%
Tsimshian
0.0
/100
|
#321
Tragic
3.2%
Hispanics or Latinos
0.0
/100
|
#322
Tragic
3.2%
Inupiat
0.0
/100
|
#323
Tragic
3.2%
Crow
0.0
/100
|
#324
Tragic
3.2%
Yaqui
0.0
/100
|
#325
Tragic
3.2%
Menominee
0.0
/100
|
#326
Tragic
3.1%
Dutch West Indians
0.0
/100
|
#327
Tragic
3.1%
Creek
0.0
/100
|
#328
Tragic
3.1%
Bangladeshis
0.0
/100
|
#329
Tragic
3.1%
Immigrants | Cabo Verde
0.0
/100
|
#330
Tragic
3.1%
Kiowa
0.0
/100
|
#331
Tragic
3.1%
Yakama
0.0
/100
|
#332
Tragic
3.1%