Immigrants from Yemen vs Yaqui Hearing Disability
COMPARE
Immigrants from Yemen
Yaqui
Hearing Disability
Hearing Disability Comparison
Immigrants from Yemen
Yaqui
2.8%
HEARING DISABILITY
92.7/ 100
METRIC RATING
111th/ 347
METRIC RANK
3.4%
HEARING DISABILITY
0.2/ 100
METRIC RATING
257th/ 347
METRIC RANK
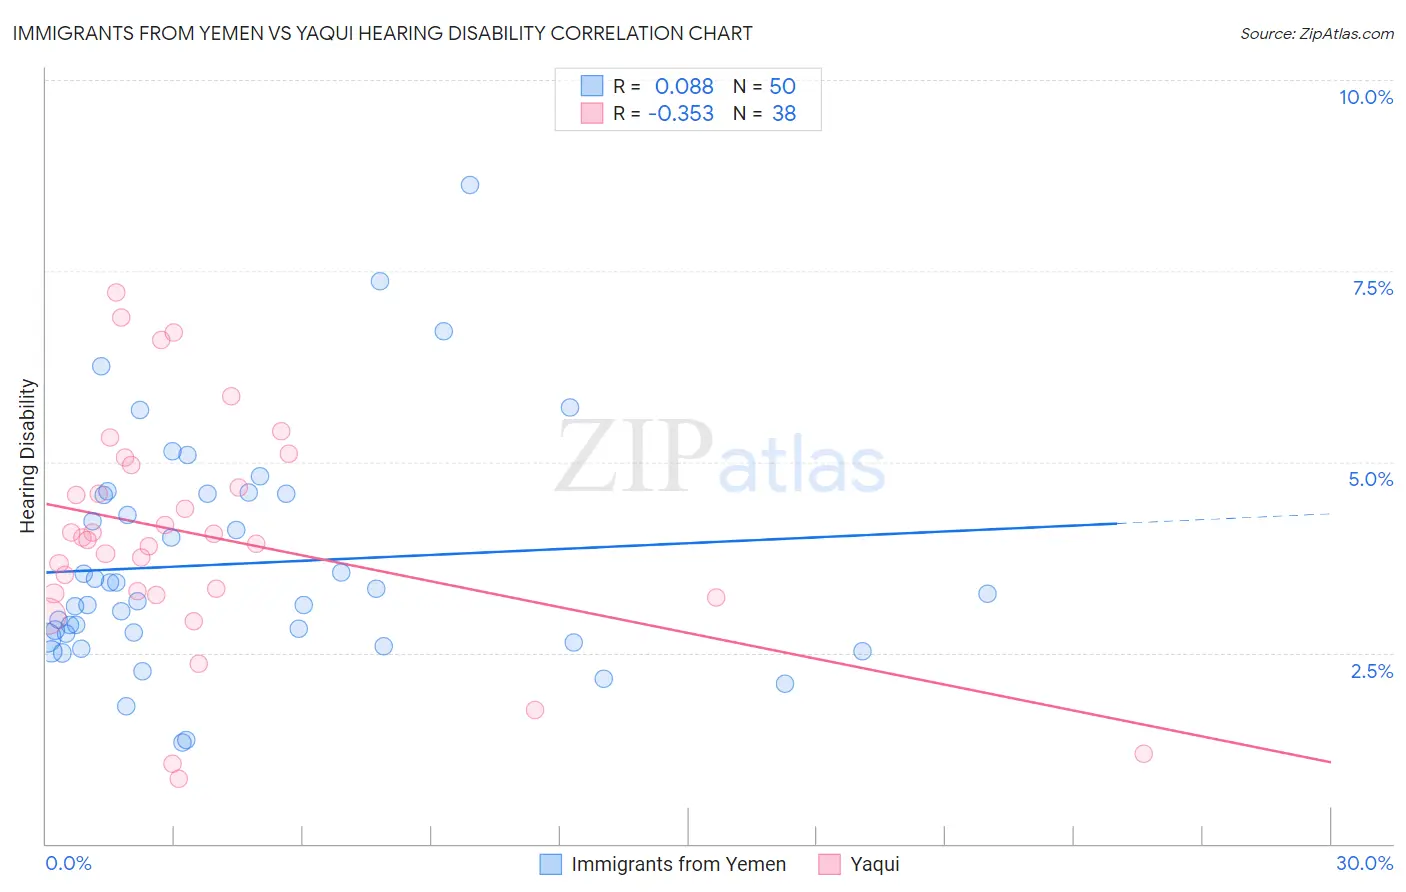
Immigrants from Yemen vs Yaqui Hearing Disability Correlation Chart
The statistical analysis conducted on geographies consisting of 82,433,214 people shows a slight positive correlation between the proportion of Immigrants from Yemen and percentage of population with hearing disability in the United States with a correlation coefficient (R) of 0.088 and weighted average of 2.8%. Similarly, the statistical analysis conducted on geographies consisting of 107,718,352 people shows a mild negative correlation between the proportion of Yaqui and percentage of population with hearing disability in the United States with a correlation coefficient (R) of -0.353 and weighted average of 3.4%, a difference of 22.4%.
Hearing Disability Correlation Summary
| Measurement | Immigrants from Yemen | Yaqui |
| Minimum | 1.3% | 0.85% |
| Maximum | 8.6% | 7.2% |
| Range | 7.3% | 6.4% |
| Mean | 3.7% | 4.0% |
| Median | 3.2% | 4.0% |
| Interquartile 25% (IQ1) | 2.7% | 3.3% |
| Interquartile 75% (IQ3) | 4.6% | 5.0% |
| Interquartile Range (IQR) | 1.9% | 1.7% |
| Standard Deviation (Sample) | 1.5% | 1.5% |
| Standard Deviation (Population) | 1.5% | 1.5% |
Similar Demographics by Hearing Disability
Demographics Similar to Immigrants from Yemen by Hearing Disability
In terms of hearing disability, the demographic groups most similar to Immigrants from Yemen are Cypriot (2.8%, a difference of 0.050%), U.S. Virgin Islander (2.8%, a difference of 0.070%), Turkish (2.8%, a difference of 0.10%), Guatemalan (2.8%, a difference of 0.17%), and Honduran (2.8%, a difference of 0.25%).
| Demographics | Rating | Rank | Hearing Disability |
| Burmese | 94.2 /100 | #104 | Exceptional 2.8% |
| Moroccans | 93.9 /100 | #105 | Exceptional 2.8% |
| Hondurans | 93.4 /100 | #106 | Exceptional 2.8% |
| Immigrants | Chile | 93.4 /100 | #107 | Exceptional 2.8% |
| Guatemalans | 93.2 /100 | #108 | Exceptional 2.8% |
| Turks | 93.0 /100 | #109 | Exceptional 2.8% |
| Cypriots | 92.9 /100 | #110 | Exceptional 2.8% |
| Immigrants | Yemen | 92.7 /100 | #111 | Exceptional 2.8% |
| U.S. Virgin Islanders | 92.5 /100 | #112 | Exceptional 2.8% |
| Immigrants | Belarus | 91.6 /100 | #113 | Exceptional 2.8% |
| Cambodians | 91.1 /100 | #114 | Exceptional 2.8% |
| Immigrants | Latin America | 90.5 /100 | #115 | Exceptional 2.8% |
| Immigrants | Immigrants | 90.3 /100 | #116 | Exceptional 2.8% |
| Immigrants | Liberia | 90.0 /100 | #117 | Excellent 2.8% |
| Zimbabweans | 89.9 /100 | #118 | Excellent 2.8% |
Demographics Similar to Yaqui by Hearing Disability
In terms of hearing disability, the demographic groups most similar to Yaqui are Northern European (3.4%, a difference of 0.070%), Slovene (3.5%, a difference of 0.30%), Portuguese (3.5%, a difference of 0.38%), Hawaiian (3.5%, a difference of 0.42%), and Hmong (3.4%, a difference of 0.45%).
| Demographics | Rating | Rank | Hearing Disability |
| Yuman | 0.4 /100 | #250 | Tragic 3.4% |
| Hungarians | 0.4 /100 | #251 | Tragic 3.4% |
| Croatians | 0.4 /100 | #252 | Tragic 3.4% |
| Carpatho Rusyns | 0.3 /100 | #253 | Tragic 3.4% |
| Slavs | 0.2 /100 | #254 | Tragic 3.4% |
| Poles | 0.2 /100 | #255 | Tragic 3.4% |
| Hmong | 0.2 /100 | #256 | Tragic 3.4% |
| Yaqui | 0.2 /100 | #257 | Tragic 3.4% |
| Northern Europeans | 0.2 /100 | #258 | Tragic 3.4% |
| Slovenes | 0.1 /100 | #259 | Tragic 3.5% |
| Portuguese | 0.1 /100 | #260 | Tragic 3.5% |
| Hawaiians | 0.1 /100 | #261 | Tragic 3.5% |
| Immigrants | North America | 0.1 /100 | #262 | Tragic 3.5% |
| Immigrants | Canada | 0.1 /100 | #263 | Tragic 3.5% |
| Immigrants | Germany | 0.1 /100 | #264 | Tragic 3.5% |