Immigrants from Cambodia vs Lumbee Single Father Poverty
COMPARE
Immigrants from Cambodia
Lumbee
Single Father Poverty
Single Father Poverty Comparison
Immigrants from Cambodia
Lumbee
14.9%
SINGLE FATHER POVERTY
99.9/ 100
METRIC RATING
46th/ 347
METRIC RANK
28.5%
SINGLE FATHER POVERTY
0.0/ 100
METRIC RATING
343rd/ 347
METRIC RANK
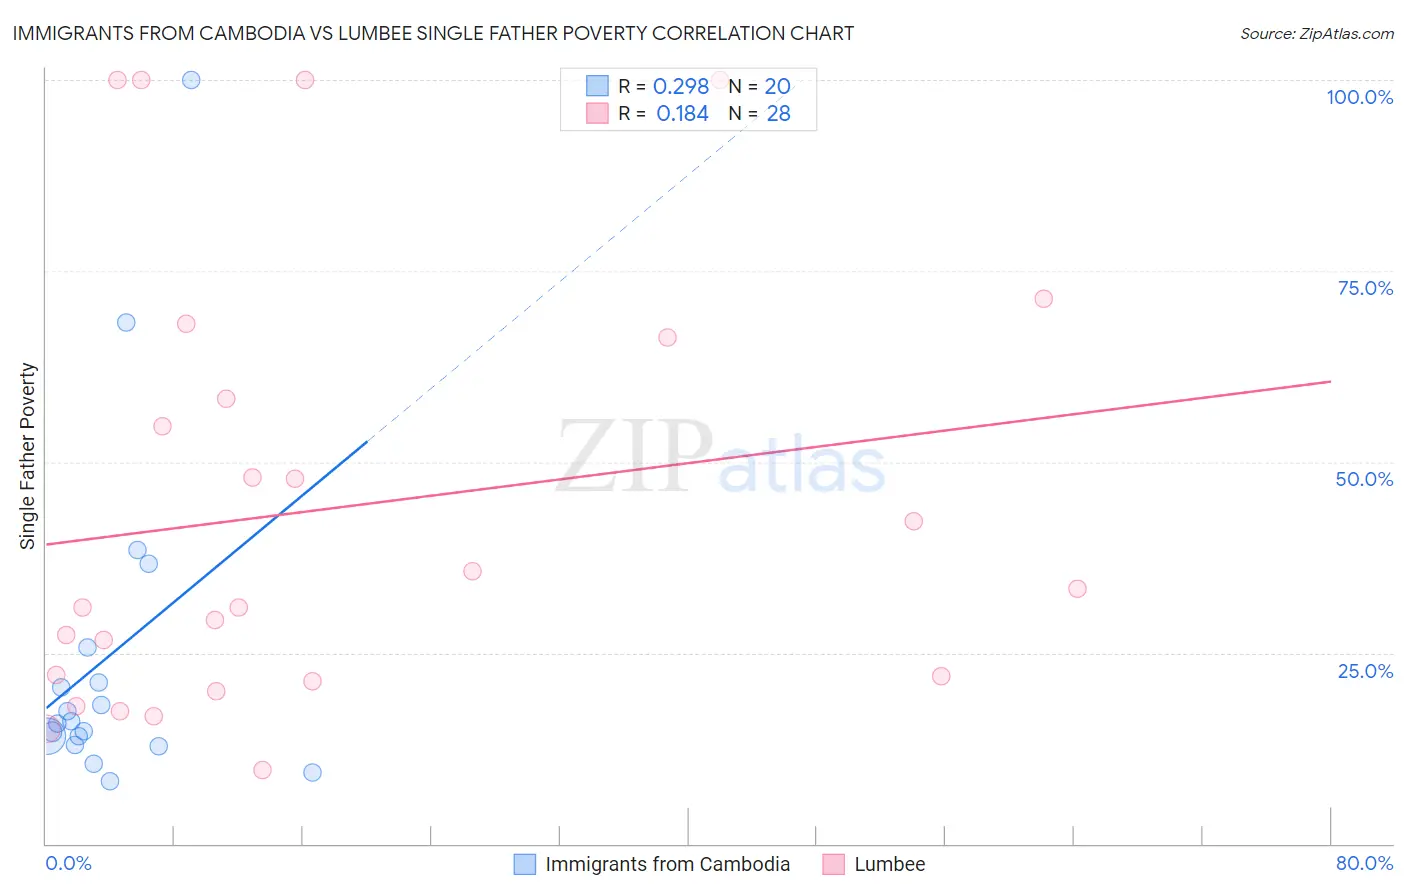
Immigrants from Cambodia vs Lumbee Single Father Poverty Correlation Chart
The statistical analysis conducted on geographies consisting of 178,014,507 people shows a weak positive correlation between the proportion of Immigrants from Cambodia and poverty level among single fathers in the United States with a correlation coefficient (R) of 0.298 and weighted average of 14.9%. Similarly, the statistical analysis conducted on geographies consisting of 83,517,726 people shows a poor positive correlation between the proportion of Lumbee and poverty level among single fathers in the United States with a correlation coefficient (R) of 0.184 and weighted average of 28.5%, a difference of 90.7%.
Single Father Poverty Correlation Summary
| Measurement | Immigrants from Cambodia | Lumbee |
| Minimum | 8.1% | 9.7% |
| Maximum | 100.0% | 100.0% |
| Range | 91.9% | 90.3% |
| Mean | 24.5% | 44.0% |
| Median | 15.9% | 32.1% |
| Interquartile 25% (IQ1) | 13.6% | 21.6% |
| Interquartile 75% (IQ3) | 23.4% | 62.2% |
| Interquartile Range (IQR) | 9.8% | 40.6% |
| Standard Deviation (Sample) | 22.5% | 28.7% |
| Standard Deviation (Population) | 21.9% | 28.2% |
Similar Demographics by Single Father Poverty
Demographics Similar to Immigrants from Cambodia by Single Father Poverty
In terms of single father poverty, the demographic groups most similar to Immigrants from Cambodia are Immigrants from China (14.9%, a difference of 0.030%), Malaysian (14.9%, a difference of 0.030%), Immigrants from Somalia (14.9%, a difference of 0.12%), Immigrants from Eastern Asia (15.0%, a difference of 0.19%), and Bhutanese (15.0%, a difference of 0.24%).
| Demographics | Rating | Rank | Single Father Poverty |
| Immigrants | Asia | 100.0 /100 | #39 | Exceptional 14.7% |
| Pima | 100.0 /100 | #40 | Exceptional 14.8% |
| Indians (Asian) | 100.0 /100 | #41 | Exceptional 14.8% |
| Immigrants | Nepal | 100.0 /100 | #42 | Exceptional 14.8% |
| Immigrants | Eritrea | 100.0 /100 | #43 | Exceptional 14.8% |
| Salvadorans | 100.0 /100 | #44 | Exceptional 14.9% |
| Immigrants | Somalia | 100.0 /100 | #45 | Exceptional 14.9% |
| Immigrants | Cambodia | 99.9 /100 | #46 | Exceptional 14.9% |
| Immigrants | China | 99.9 /100 | #47 | Exceptional 14.9% |
| Malaysians | 99.9 /100 | #48 | Exceptional 14.9% |
| Immigrants | Eastern Asia | 99.9 /100 | #49 | Exceptional 15.0% |
| Bhutanese | 99.9 /100 | #50 | Exceptional 15.0% |
| Immigrants | Pakistan | 99.9 /100 | #51 | Exceptional 15.0% |
| Immigrants | El Salvador | 99.9 /100 | #52 | Exceptional 15.0% |
| Immigrants | Kenya | 99.9 /100 | #53 | Exceptional 15.0% |
Demographics Similar to Lumbee by Single Father Poverty
In terms of single father poverty, the demographic groups most similar to Lumbee are Yuman (28.4%, a difference of 0.33%), Navajo (29.2%, a difference of 2.6%), Hopi (27.2%, a difference of 4.9%), Crow (30.3%, a difference of 6.3%), and Houma (26.7%, a difference of 6.5%).
| Demographics | Rating | Rank | Single Father Poverty |
| Natives/Alaskans | 0.0 /100 | #333 | Tragic 22.4% |
| Kiowa | 0.0 /100 | #334 | Tragic 22.5% |
| Shoshone | 0.0 /100 | #335 | Tragic 22.9% |
| Cajuns | 0.0 /100 | #336 | Tragic 23.1% |
| Sioux | 0.0 /100 | #337 | Tragic 23.9% |
| Arapaho | 0.0 /100 | #338 | Tragic 24.0% |
| Apache | 0.0 /100 | #339 | Tragic 24.2% |
| Houma | 0.0 /100 | #340 | Tragic 26.7% |
| Hopi | 0.0 /100 | #341 | Tragic 27.2% |
| Yuman | 0.0 /100 | #342 | Tragic 28.4% |
| Lumbee | 0.0 /100 | #343 | Tragic 28.5% |
| Navajo | 0.0 /100 | #344 | Tragic 29.2% |
| Crow | 0.0 /100 | #345 | Tragic 30.3% |
| Puerto Ricans | 0.0 /100 | #346 | Tragic 31.5% |
| Yup'ik | 0.0 /100 | #347 | Tragic 32.5% |